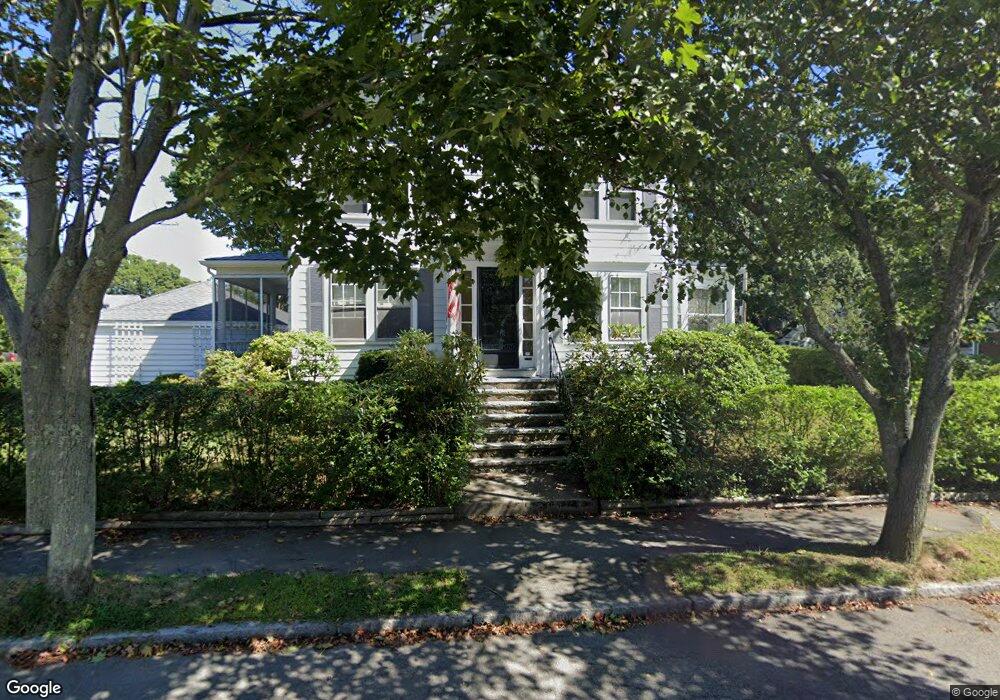
15 Sargent Rd Swampscott, MA 01907
Estimated Value: $813,288 - $901,000
3
Beds
2
Baths
1,704
Sq Ft
$498/Sq Ft
Est. Value
About This Home
This home is located at 15 Sargent Rd, Swampscott, MA 01907 and is currently estimated at $848,072, approximately $497 per square foot. 15 Sargent Rd is a home located in Essex County with nearby schools including Swampscott Middle School and Swampscott High School.
Ownership History
Date
Name
Owned For
Owner Type
Purchase Details
Closed on
Sep 23, 1988
Sold by
Fiermonte Nich T
Bought by
Cerra Anthony W
Current Estimated Value
Create a Home Valuation Report for This Property
The Home Valuation Report is an in-depth analysis detailing your home's value as well as a comparison with similar homes in the area
Home Values in the Area
Average Home Value in this Area
Purchase History
We collect this data history from publicly available records. To have your information removed, we recommend requesting removal directly through your county’s website.
| Date | Buyer | Sale Price | Title Company |
|---|---|---|---|
| Cerra Anthony W | $236,000 | -- |
Source: Public Records
Mortgage History
We collect this data history from publicly available records. To have your information removed, we recommend requesting removal directly through your county’s website.
| Date | Status | Borrower | Loan Amount |
|---|---|---|---|
| Closed | Cerra Anthony W | $84,800 | |
| Closed | Cerra Anthony W | $124,000 |
Source: Public Records
Tax History
| Year | Tax Paid | Tax Assessment Tax Assessment Total Assessment is a certain percentage of the fair market value that is determined by local assessors to be the total taxable value of land and additions on the property. | Land | Improvement |
|---|---|---|---|---|
| 2025 | $8,131 | $708,900 | $344,800 | $364,100 |
| 2024 | $7,905 | $688,000 | $328,000 | $360,000 |
| 2023 | $7,369 | $627,700 | $294,400 | $333,300 |
| 2022 | $7,021 | $547,200 | $252,300 | $294,900 |
| 2021 | $6,943 | $503,100 | $235,500 | $267,600 |
| 2020 | $6,774 | $473,700 | $210,300 | $263,400 |
| 2019 | $6,880 | $452,600 | $189,200 | $263,400 |
| 2018 | $6,805 | $425,300 | $172,400 | $252,900 |
| 2017 | $6,938 | $397,600 | $161,500 | $236,100 |
| 2016 | $6,890 | $397,600 | $161,500 | $236,100 |
| 2015 | $6,819 | $397,600 | $161,500 | $236,100 |
| 2014 | $6,386 | $341,500 | $134,600 | $206,900 |
Source: Public Records
Map
Nearby Homes
- 49 Ocean View Rd
- 481 Humphrey St
- 90 Puritan Rd
- 53 Puritan Rd
- 5 Lexington Park
- 84 Greenwood Ave
- 251 Puritan Rd
- 31 Lincoln House Point
- 2 Ocean Ave
- 20 Ocean Ave
- 21 Phillips Ave
- 404 Paradise Rd Unit 1C
- 35 Littles Point Rd Unit S201
- 128 Ocean Ave
- 6 Elmwood Rd
- 28 Claremont Terrace Unit 6
- 104-106 Burrill St
- 143 Burrill St Unit 301
- 2 Ellis Terrace
- 1004 Paradise Rd Unit PHB
Your Personal Tour Guide
Ask me questions while you tour the home.