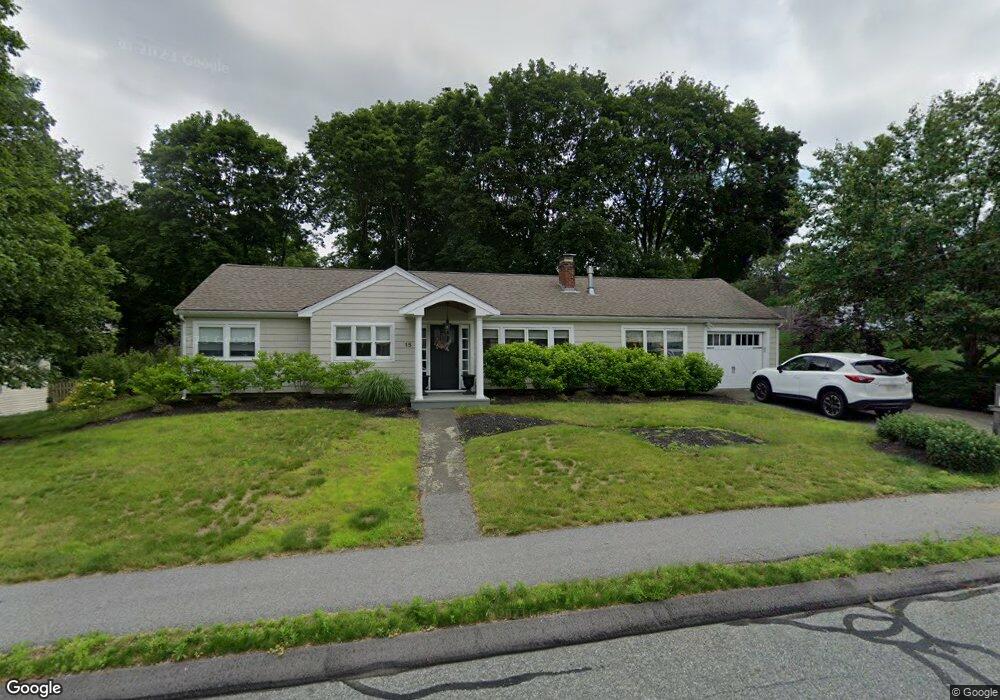
15 Waring Rd Natick, MA 01760
Estimated Value: $751,000 - $923,875
3
Beds
1
Bath
1,402
Sq Ft
$572/Sq Ft
Est. Value
About This Home
This home is located at 15 Waring Rd, Natick, MA 01760 and is currently estimated at $801,969, approximately $572 per square foot. 15 Waring Rd is a home located in Middlesex County with nearby schools including Natick High School, Bennett-Hemenway (Ben-Hem) Elementary School, and Wilson Middle School.
Ownership History
Date
Name
Owned For
Owner Type
Purchase Details
Closed on
Apr 13, 2005
Sold by
Prim Warren W
Bought by
Thomas Karen L and Prim Karen T
Current Estimated Value
Home Financials for this Owner
Home Financials are based on the most recent Mortgage that was taken out on this home.
Original Mortgage
$73,500
Outstanding Balance
$37,929
Interest Rate
5.78%
Mortgage Type
Purchase Money Mortgage
Estimated Equity
$764,040
Create a Home Valuation Report for This Property
The Home Valuation Report is an in-depth analysis detailing your home's value as well as a comparison with similar homes in the area
Home Values in the Area
Average Home Value in this Area
Purchase History
| Date | Buyer | Sale Price | Title Company |
|---|---|---|---|
| Thomas Karen L | $5,000 | -- |
Source: Public Records
Mortgage History
| Date | Status | Borrower | Loan Amount |
|---|---|---|---|
| Open | Thomas Karen L | $73,500 |
Source: Public Records
Tax History
| Year | Tax Paid | Tax Assessment Tax Assessment Total Assessment is a certain percentage of the fair market value that is determined by local assessors to be the total taxable value of land and additions on the property. | Land | Improvement |
|---|---|---|---|---|
| 2025 | $7,433 | $621,500 | $452,000 | $169,500 |
| 2024 | $7,236 | $590,200 | $426,900 | $163,300 |
| 2023 | $7,039 | $556,900 | $401,600 | $155,300 |
| 2022 | $6,849 | $513,400 | $366,300 | $147,100 |
| 2021 | $4,827 | $481,400 | $346,200 | $135,200 |
| 2020 | $4,632 | $466,400 | $331,200 | $135,200 |
| 2019 | $4,680 | $466,400 | $331,200 | $135,200 |
| 2018 | $5,579 | $427,500 | $301,100 | $126,400 |
| 2017 | $4,589 | $390,500 | $266,400 | $124,100 |
| 2016 | $5,079 | $374,300 | $251,400 | $122,900 |
| 2015 | $5,030 | $364,000 | $251,400 | $112,600 |
Source: Public Records
Map
Nearby Homes
- 14 Drury Ln
- 50 Wethersfield Rd
- 48 Wethersfield Rd
- 5 Bradford Rd
- 4 Richard Rd
- 278 N Main St
- 1 Richard Rd
- 6 Cypress Rd
- 29 Irving Rd
- 25 Irving Rd
- 8 Liberty St
- 6 Ash St
- 340 N Main St
- 136 Commonwealth Rd
- 8 Arlington Cir
- 37 Longfellow Rd
- 13 Shawmut Avenue Extension
- 26 Longfellow Rd
- 45 W Plain St Unit 1
- 7 Jackson Ct Unit B
Your Personal Tour Guide
Ask me questions while you tour the home.