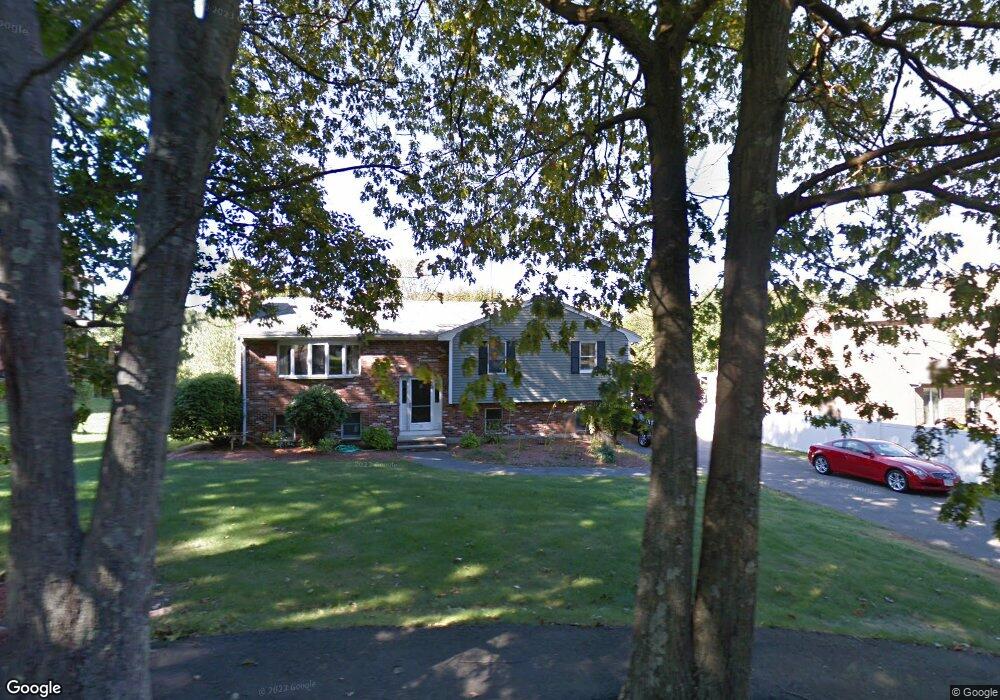
15 West St Danvers, MA 01923
Estimated Value: $934,941 - $1,076,000
3
Beds
3
Baths
2,640
Sq Ft
$381/Sq Ft
Est. Value
About This Home
This home is located at 15 West St, Danvers, MA 01923 and is currently estimated at $1,005,735, approximately $380 per square foot. 15 West St is a home located in Essex County with nearby schools including Danvers High School, St. Mary of the Annunciation School, and Plumfield Academy.
Ownership History
Date
Name
Owned For
Owner Type
Purchase Details
Closed on
May 18, 2017
Sold by
Raby Robert
Bought by
Sanidas Matthew and Sanidas Jean M
Current Estimated Value
Home Financials for this Owner
Home Financials are based on the most recent Mortgage that was taken out on this home.
Original Mortgage
$320,000
Outstanding Balance
$262,265
Interest Rate
4.1%
Mortgage Type
New Conventional
Estimated Equity
$743,470
Purchase Details
Closed on
Oct 21, 2015
Sold by
Raby Robert and Raby Janine M
Bought by
Raby Robert
Create a Home Valuation Report for This Property
The Home Valuation Report is an in-depth analysis detailing your home's value as well as a comparison with similar homes in the area
Home Values in the Area
Average Home Value in this Area
Purchase History
| Date | Buyer | Sale Price | Title Company |
|---|---|---|---|
| Sanidas Matthew | $595,000 | -- | |
| Raby Robert | -- | -- |
Source: Public Records
Mortgage History
| Date | Status | Borrower | Loan Amount |
|---|---|---|---|
| Open | Sanidas Matthew | $320,000 |
Source: Public Records
Tax History
| Year | Tax Paid | Tax Assessment Tax Assessment Total Assessment is a certain percentage of the fair market value that is determined by local assessors to be the total taxable value of land and additions on the property. | Land | Improvement |
|---|---|---|---|---|
| 2025 | $9,029 | $821,600 | $422,500 | $399,100 |
| 2024 | $8,354 | $751,900 | $415,500 | $336,400 |
| 2023 | $8,227 | $700,200 | $380,200 | $320,000 |
| 2022 | $8,000 | $631,900 | $338,000 | $293,900 |
| 2021 | $8,380 | $627,700 | $333,800 | $293,900 |
| 2020 | $8,519 | $652,300 | $333,800 | $318,500 |
| 2019 | $8,240 | $620,500 | $302,800 | $317,700 |
| 2018 | $7,925 | $585,300 | $302,800 | $282,500 |
| 2017 | $7,419 | $522,800 | $260,500 | $262,300 |
| 2016 | $7,225 | $508,800 | $246,500 | $262,300 |
| 2015 | $6,958 | $466,700 | $225,300 | $241,400 |
Source: Public Records
Map
Nearby Homes
- 513 Maple St
- 98 Newbury St Unit 18B
- 98 Newbury St Unit 2B
- 98 Newbury St Unit 23B
- 8 Bellingham Ct Unit 92
- 103 Newbury St Unit 1
- 19 Peachey Cir
- 1 Mills Point Unit 1
- 10 Oak St
- 3 Hills Rd
- 320 Newbury St Unit 704
- 2 Tyler Ln
- 47 Maple St Unit A
- 286 Newbury St Unit 110
- 32 Cabral Dr
- 15 Rowell Ln Unit 15
- 1 Couture Way
- 12 Couture Way
- 52 East St
- 38 Village Rd Unit 515
Your Personal Tour Guide
Ask me questions while you tour the home.