150 Viscount Rd Warwick, RI 02889
Conimicut-Shawomet NeighborhoodEstimated Value: $432,959 - $472,000
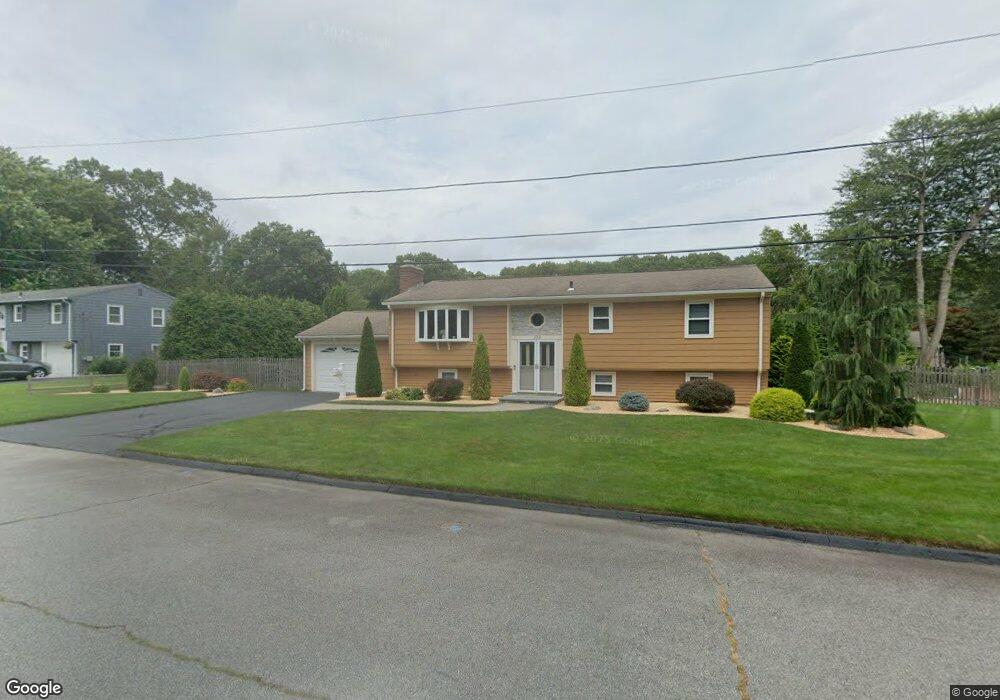
About This Home
This home is located at 150 Viscount Rd, Warwick, RI 02889 and is currently estimated at $460,240, approximately $242 per square foot. 150 Viscount Rd is a home located in Kent County with nearby schools including Saint Kevin School and Bishop Hendricken High School.
Ownership History
We collect this data history from publicly available records. To have your information removed, we recommend requesting removal directly through your county’s website.
Purchase Details
Purchase Details
Home Financials for this Owner
Home Financials are based on the most recent Mortgage that was taken out on this home.Purchase Details
Home Values in the Area
Average Home Value in this Area
Purchase History
We collect this data history from publicly available records. To have your information removed, we recommend requesting removal directly through your county’s website.
| Date | Buyer | Sale Price | Title Company |
|---|---|---|---|
| -- | -- | ||
| $121,000 | -- | ||
| $119,000 | -- | ||
| $119,000 | -- |
Mortgage History
We collect this data history from publicly available records. To have your information removed, we recommend requesting removal directly through your county’s website.
| Date | Status | Borrower | Loan Amount |
|---|---|---|---|
| Previous Owner | $135,000 | ||
| Previous Owner | $145,000 | ||
| Previous Owner | $115,000 | ||
| Previous Owner | $118,000 |
Tax History
We collect this data history from publicly available records. To have your information removed, we recommend requesting removal directly through your county’s website.
| Year | Tax Paid | Tax Assessment Tax Assessment Total Assessment is a certain percentage of the fair market value that is determined by local assessors to be the total taxable value of land and additions on the property. | Land | Improvement |
|---|---|---|---|---|
| 2025 | $5,255 | $413,800 | $115,500 | $298,300 |
| 2024 | $5,182 | $358,100 | $100,400 | $257,700 |
| 2023 | $5,081 | $358,100 | $100,400 | $257,700 |
| 2022 | $4,774 | $254,900 | $58,800 | $196,100 |
| 2021 | $4,774 | $254,900 | $58,800 | $196,100 |
| 2020 | $4,774 | $254,900 | $58,800 | $196,100 |
| 2019 | $4,774 | $254,900 | $58,800 | $196,100 |
| 2018 | $4,139 | $199,000 | $58,800 | $140,200 |
| 2017 | $4,028 | $199,000 | $58,800 | $140,200 |
| 2016 | $4,028 | $199,000 | $58,800 | $140,200 |
| 2015 | $4,028 | $194,100 | $67,900 | $126,200 |
| 2014 | $3,894 | $194,100 | $67,900 | $126,200 |
| 2013 | $3,841 | $194,100 | $67,900 | $126,200 |
Map
- 325 Church Ave
- 320 Church Ave
- 43 New Britain Dr
- 20 Killey Ave
- 11 Nathan Rd
- 116 Ardway Ave
- 88 Glenbrook Rd
- 80 Killey Ave
- 600 Cole Farm Rd
- 46 Merle St
- 269 Bellman Ave
- 52 Merle St
- 301 W Shore Rd Unit 19
- 81 Allen Ave
- 97 Delwood Rd
- 112 Old Warwick Ave
- 121 Fern St
- 32 Stillwater Dr
- 128 Fern St
- 15 Community Rd
Ask me questions while you tour the home.