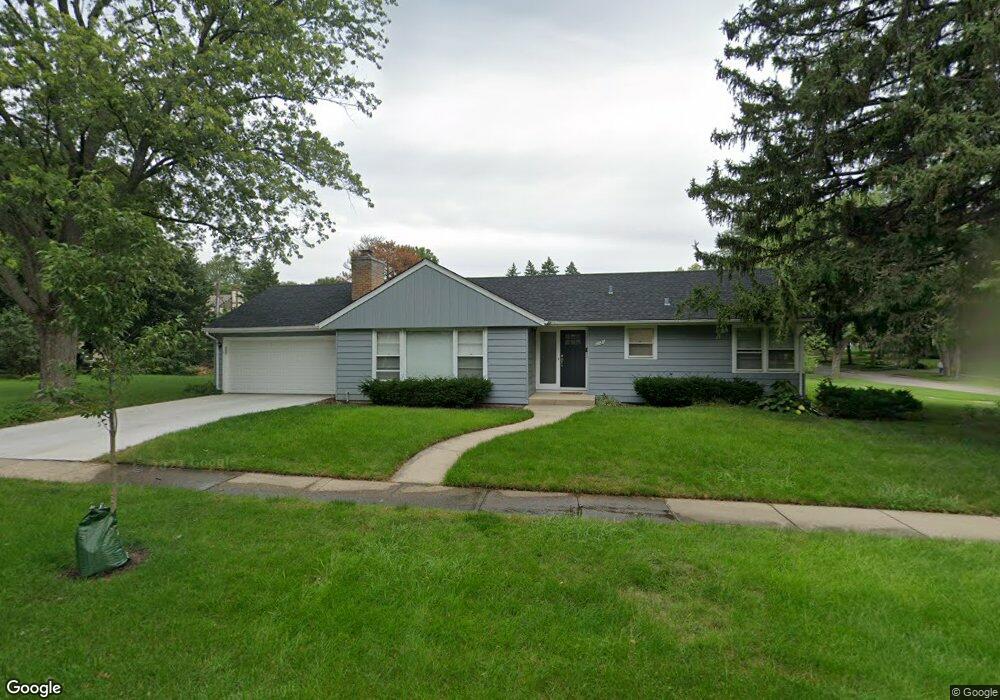
1521 E Evergreen St Wheaton, IL 60187
Southeast Wheaton NeighborhoodEstimated Value: $395,000 - $438,000
3
Beds
1
Bath
1,276
Sq Ft
$330/Sq Ft
Est. Value
About This Home
This home is located at 1521 E Evergreen St, Wheaton, IL 60187 and is currently estimated at $421,460, approximately $330 per square foot. 1521 E Evergreen St is a home located in DuPage County with nearby schools including Lowell Elementary School, Franklin Middle School, and Wheaton North High School.
Ownership History
Date
Name
Owned For
Owner Type
Purchase Details
Closed on
May 22, 2025
Sold by
Regan Kyle and Regan Thrudy
Bought by
Regan Kyle
Current Estimated Value
Purchase Details
Closed on
Jun 28, 2017
Sold by
Wolff William B
Bought by
Regan Kyle and Regan Thrudy
Home Financials for this Owner
Home Financials are based on the most recent Mortgage that was taken out on this home.
Original Mortgage
$252,000
Interest Rate
3.91%
Mortgage Type
New Conventional
Purchase Details
Closed on
Jul 1, 2015
Sold by
Butts Marianne T and Leavey Judith A
Bought by
Wolff William B
Home Financials for this Owner
Home Financials are based on the most recent Mortgage that was taken out on this home.
Original Mortgage
$132,000
Interest Rate
3.75%
Mortgage Type
Adjustable Rate Mortgage/ARM
Purchase Details
Closed on
Oct 18, 2010
Sold by
Fifth Third Bank
Bought by
Ostrander Linda M and Leavey Judith A
Purchase Details
Closed on
Jul 29, 1999
Sold by
Wolff Clarence W
Bought by
Old Kent Bank and Clarence W Wolff Trust
Create a Home Valuation Report for This Property
The Home Valuation Report is an in-depth analysis detailing your home's value as well as a comparison with similar homes in the area
Home Values in the Area
Average Home Value in this Area
Purchase History
| Date | Buyer | Sale Price | Title Company |
|---|---|---|---|
| Regan Kyle | -- | None Listed On Document | |
| Regan Kyle | $280,000 | First American Title Insuran | |
| Wolff William B | $165,000 | Fidelity National Title | |
| Ostrander Linda M | -- | None Available | |
| Old Kent Bank | -- | -- |
Source: Public Records
Mortgage History
| Date | Status | Borrower | Loan Amount |
|---|---|---|---|
| Previous Owner | Regan Kyle | $252,000 | |
| Previous Owner | Wolff William B | $132,000 |
Source: Public Records
Tax History
| Year | Tax Paid | Tax Assessment Tax Assessment Total Assessment is a certain percentage of the fair market value that is determined by local assessors to be the total taxable value of land and additions on the property. | Land | Improvement |
|---|---|---|---|---|
| 2024 | $7,367 | $122,296 | $37,579 | $84,717 |
| 2023 | $7,067 | $112,570 | $34,590 | $77,980 |
| 2022 | $6,952 | $106,390 | $32,690 | $73,700 |
| 2021 | $6,926 | $103,860 | $31,910 | $71,950 |
| 2020 | $6,903 | $102,890 | $31,610 | $71,280 |
| 2019 | $6,742 | $100,180 | $30,780 | $69,400 |
| 2018 | $6,757 | $99,290 | $32,780 | $66,510 |
| 2017 | $6,652 | $95,630 | $31,570 | $64,060 |
| 2016 | $6,559 | $91,810 | $30,310 | $61,500 |
| 2015 | $6,503 | $87,590 | $28,920 | $58,670 |
| 2014 | $6,386 | $84,760 | $25,090 | $59,670 |
| 2013 | $6,222 | $85,010 | $25,160 | $59,850 |
Source: Public Records
Map
Nearby Homes
- 1607 E Indiana St
- 1818 E Indiana St
- 1500 Pershing Ave
- 1728 Pershing Ave Unit 3
- 213 S Summit St
- 1010 E Illinois St
- 123 S Blanchard St
- 510 S President St
- 119 S Williston St
- 97 N Kenilworth Ave
- 220 S President St
- 1690 Darwin Ct Unit D
- 210 Hill Ave
- 302 Roscommon Ct
- 1614 Sawyer Ave
- 502 N Blanchard St
- 156 Sunset Ave
- 421 E Willow Ave
- 1581 Groton Ln
- 270 S Ott Ave
- 522 S Prospect St
- 514 S Prospect St
- 1503 E Evergreen St
- 1516 E Evergreen St
- 1520 E Evergreen St
- 523 S Summit St
- 510 S Prospect St
- 519 S Prospect St
- 517 S Summit St
- 1512 E Evergreen St
- 506 S Prospect St
- 603 S Prospect St
- 506 S Prospect St
- 511 S Summit St
- 1506 E Evergreen St
- 1607 E Evergreen St
- 513 S Prospect St
- 1606 E Evergreen St
- 507 S Summit St
- 502 S Prospect St
Your Personal Tour Guide
Ask me questions while you tour the home.