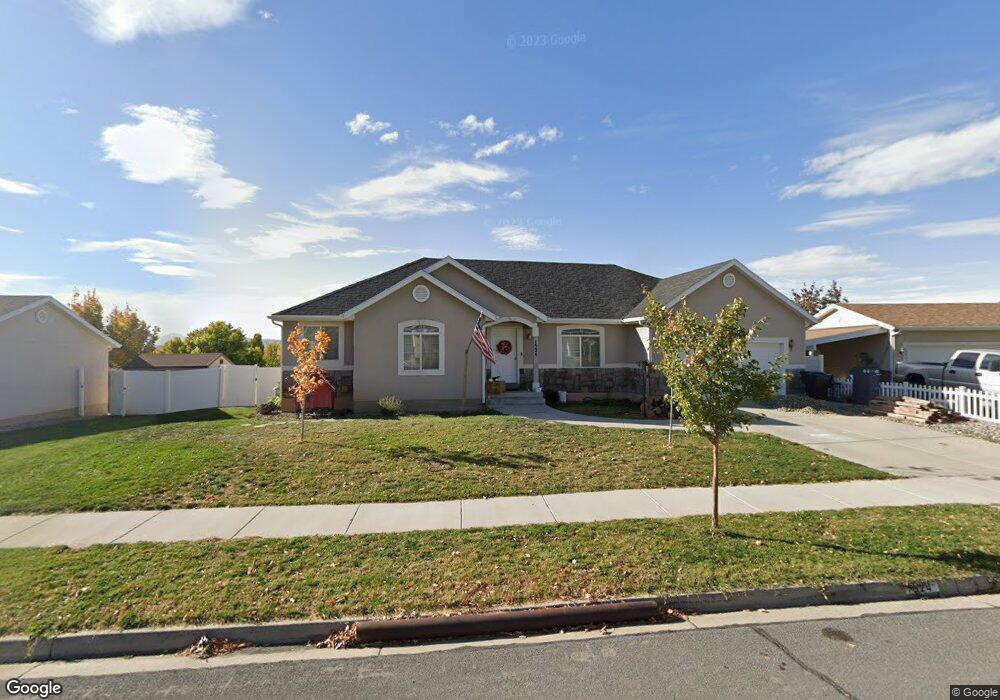
1524 S 30 E Payson, UT 84651
Estimated Value: $511,000 - $600,000
3
Beds
2
Baths
3,408
Sq Ft
$163/Sq Ft
Est. Value
About This Home
This home is located at 1524 S 30 E, Payson, UT 84651 and is currently estimated at $555,869, approximately $163 per square foot. 1524 S 30 E is a home located in Utah County with nearby schools including Spring Lake Elementary, Payson High School, and Payson Junior High School.
Ownership History
Date
Name
Owned For
Owner Type
Purchase Details
Closed on
Aug 1, 2014
Sold by
Wolsey Brent and Wolsey Lindsay B
Bought by
Knuteson Kirsti Krogvik
Current Estimated Value
Purchase Details
Closed on
Feb 22, 2001
Sold by
Salisbury Development Lc
Bought by
Wolsey Brent and Wolsey Lindsay B
Home Financials for this Owner
Home Financials are based on the most recent Mortgage that was taken out on this home.
Original Mortgage
$157,379
Interest Rate
6.89%
Mortgage Type
FHA
Create a Home Valuation Report for This Property
The Home Valuation Report is an in-depth analysis detailing your home's value as well as a comparison with similar homes in the area
Home Values in the Area
Average Home Value in this Area
Purchase History
| Date | Buyer | Sale Price | Title Company |
|---|---|---|---|
| Knuteson Kirsti Krogvik | -- | Advanced Title | |
| Wolsey Brent | -- | Provo Land Title Company |
Source: Public Records
Mortgage History
| Date | Status | Borrower | Loan Amount |
|---|---|---|---|
| Previous Owner | Wolsey Brent | $157,379 |
Source: Public Records
Tax History
| Year | Tax Paid | Tax Assessment Tax Assessment Total Assessment is a certain percentage of the fair market value that is determined by local assessors to be the total taxable value of land and additions on the property. | Land | Improvement |
|---|---|---|---|---|
| 2025 | $2,557 | $272,305 | -- | -- |
| 2024 | $2,557 | $260,205 | $0 | $0 |
| 2023 | $2,628 | $268,180 | $0 | $0 |
| 2022 | $2,588 | $259,765 | $0 | $0 |
| 2021 | $2,193 | $353,000 | $109,700 | $243,300 |
| 2020 | $2,079 | $327,500 | $99,700 | $227,800 |
| 2019 | $1,922 | $310,300 | $82,500 | $227,800 |
| 2018 | $1,737 | $270,300 | $72,200 | $198,100 |
| 2017 | $1,605 | $134,310 | $0 | $0 |
| 2016 | $1,542 | $128,260 | $0 | $0 |
| 2015 | $1,425 | $117,645 | $0 | $0 |
| 2014 | $1,251 | $104,060 | $0 | $0 |
Source: Public Records
Map
Nearby Homes
- 582 E 1250 S Unit 137
- 245 W 1770 S
- 1848 S 100 E Unit 3
- 609 W Saddlebrook Dr
- 1632 S 240 W Unit 47
- 1872 S 100 E Unit 6
- 1835 S 410 W
- 1631 S Highway 198
- 288 E 900 S
- 627 W 1100 S
- 1589 S 840 W
- 1163 S 730 W
- 1566 S 840 W
- 876 Greenridge Ave
- 1468 S 910 W
- 1172 S 880 W
- 1320 S 950 W
- 736 S 500 E
- 88 W 700 S
- 252 E 670 S Unit 2
Your Personal Tour Guide
Ask me questions while you tour the home.