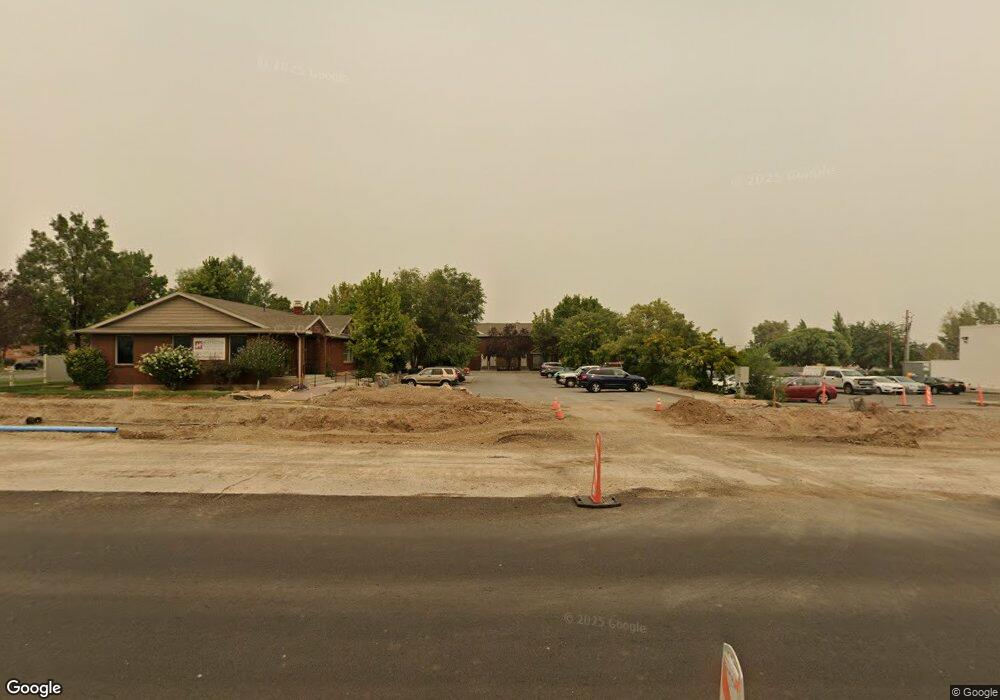
153 E Main St Unit C Santaquin, UT 84655
Estimated Value: $316,000 - $362,000
3
Beds
3
Baths
2,006
Sq Ft
$166/Sq Ft
Est. Value
About This Home
This home is located at 153 E Main St Unit C, Santaquin, UT 84655 and is currently estimated at $332,368, approximately $165 per square foot. 153 E Main St Unit C is a home located in Utah County with nearby schools including Apple Valley Elementary, Payson Junior High School, and Mt. Nebo Middle.
Ownership History
Date
Name
Owned For
Owner Type
Purchase Details
Closed on
Mar 27, 2015
Sold by
Haslam J Kevan
Bought by
Castrellon Juan
Current Estimated Value
Home Financials for this Owner
Home Financials are based on the most recent Mortgage that was taken out on this home.
Original Mortgage
$137,365
Outstanding Balance
$106,129
Interest Rate
3.84%
Mortgage Type
FHA
Estimated Equity
$226,239
Purchase Details
Closed on
Sep 16, 2013
Sold by
Degraffenried James E
Bought by
Haslam J Kevan
Home Financials for this Owner
Home Financials are based on the most recent Mortgage that was taken out on this home.
Original Mortgage
$126,074
Interest Rate
4.25%
Mortgage Type
FHA
Create a Home Valuation Report for This Property
The Home Valuation Report is an in-depth analysis detailing your home's value as well as a comparison with similar homes in the area
Home Values in the Area
Average Home Value in this Area
Purchase History
| Date | Buyer | Sale Price | Title Company |
|---|---|---|---|
| Castrellon Juan | -- | North American Title | |
| Haslam J Kevan | -- | North American Title |
Source: Public Records
Mortgage History
| Date | Status | Borrower | Loan Amount |
|---|---|---|---|
| Open | Castrellon Juan | $137,365 | |
| Previous Owner | Haslam J Kevan | $126,074 |
Source: Public Records
Tax History
| Year | Tax Paid | Tax Assessment Tax Assessment Total Assessment is a certain percentage of the fair market value that is determined by local assessors to be the total taxable value of land and additions on the property. | Land | Improvement |
|---|---|---|---|---|
| 2025 | $1,817 | $166,815 | -- | -- |
| 2024 | $1,817 | $180,895 | $0 | $0 |
| 2023 | $1,722 | $171,985 | $0 | $0 |
| 2022 | $1,500 | $154,605 | $0 | $0 |
| 2021 | $1,323 | $211,300 | $31,700 | $179,600 |
| 2020 | $1,228 | $190,000 | $28,500 | $161,500 |
| 2019 | $1,106 | $175,000 | $24,000 | $151,000 |
| 2018 | $997 | $150,500 | $18,000 | $132,500 |
| 2017 | $969 | $78,100 | $0 | $0 |
| 2016 | $961 | $75,900 | $0 | $0 |
| 2015 | $852 | $66,000 | $0 | $0 |
| 2014 | $853 | $66,000 | $0 | $0 |
Source: Public Records
Map
Nearby Homes
Your Personal Tour Guide
Ask me questions while you tour the home.