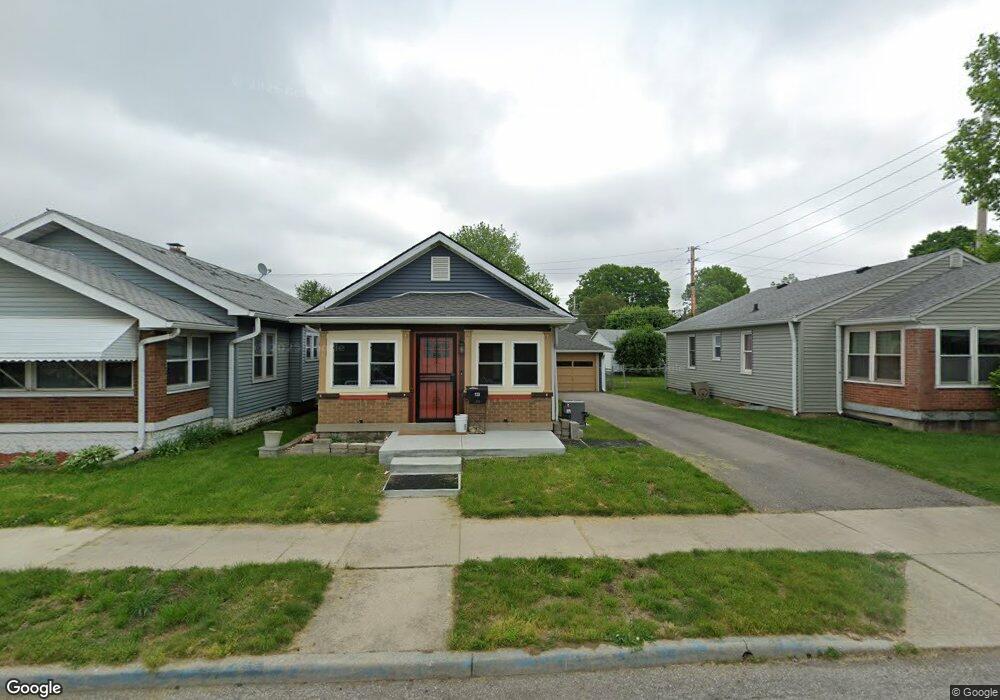
153 S 9th Ave Beech Grove, IN 46107
Estimated Value: $153,000 - $182,000
2
Beds
1
Bath
840
Sq Ft
$201/Sq Ft
Est. Value
About This Home
This home is located at 153 S 9th Ave, Beech Grove, IN 46107 and is currently estimated at $168,723, approximately $200 per square foot. 153 S 9th Ave is a home located in Marion County with nearby schools including Hornet Park Elementary School, Central Elementary School, and South Grove Intermediate School.
Ownership History
Date
Name
Owned For
Owner Type
Purchase Details
Closed on
Feb 18, 2026
Sold by
Walsh Larry L
Bought by
Walsh Larry L and Via Judith A
Current Estimated Value
Purchase Details
Closed on
Oct 5, 2019
Sold by
Walsh Larry L and Sherman Felicia S
Bought by
Walsh Larry L
Purchase Details
Closed on
Aug 31, 2007
Sold by
Frazier Charles L and Frazier Berniece
Bought by
Walsh Larry L and Sherman Felicia S
Home Financials for this Owner
Home Financials are based on the most recent Mortgage that was taken out on this home.
Original Mortgage
$76,794
Interest Rate
6.55%
Mortgage Type
FHA
Create a Home Valuation Report for This Property
The Home Valuation Report is an in-depth analysis detailing your home's value as well as a comparison with similar homes in the area
Home Values in the Area
Average Home Value in this Area
Purchase History
| Date | Buyer | Sale Price | Title Company |
|---|---|---|---|
| Walsh Larry L | -- | None Listed On Document | |
| Walsh Larry L | $50,142 | Stewart Title | |
| Walsh Larry L | -- | Stewart Title |
Source: Public Records
Mortgage History
| Date | Status | Borrower | Loan Amount |
|---|---|---|---|
| Previous Owner | Walsh Larry L | $76,794 |
Source: Public Records
Tax History
| Year | Tax Paid | Tax Assessment Tax Assessment Total Assessment is a certain percentage of the fair market value that is determined by local assessors to be the total taxable value of land and additions on the property. | Land | Improvement |
|---|---|---|---|---|
| 2025 | $1,848 | $145,600 | $17,000 | $128,600 |
| 2024 | $2,006 | $140,900 | $17,000 | $123,900 |
| 2023 | $2,006 | $126,100 | $17,000 | $109,100 |
| 2022 | $1,883 | $116,700 | $17,000 | $99,700 |
| 2021 | $1,502 | $98,800 | $17,000 | $81,800 |
| 2020 | $1,238 | $89,100 | $17,000 | $72,100 |
| 2019 | $1,132 | $85,600 | $14,000 | $71,600 |
| 2018 | $392 | $75,000 | $14,000 | $61,000 |
| 2017 | $397 | $74,500 | $14,000 | $60,500 |
| 2016 | $366 | $72,400 | $14,000 | $58,400 |
| 2014 | $266 | $65,500 | $14,000 | $51,500 |
| 2013 | $224 | $58,600 | $14,000 | $44,600 |
Source: Public Records
Map
Nearby Homes
Your Personal Tour Guide
Ask me questions while you tour the home.