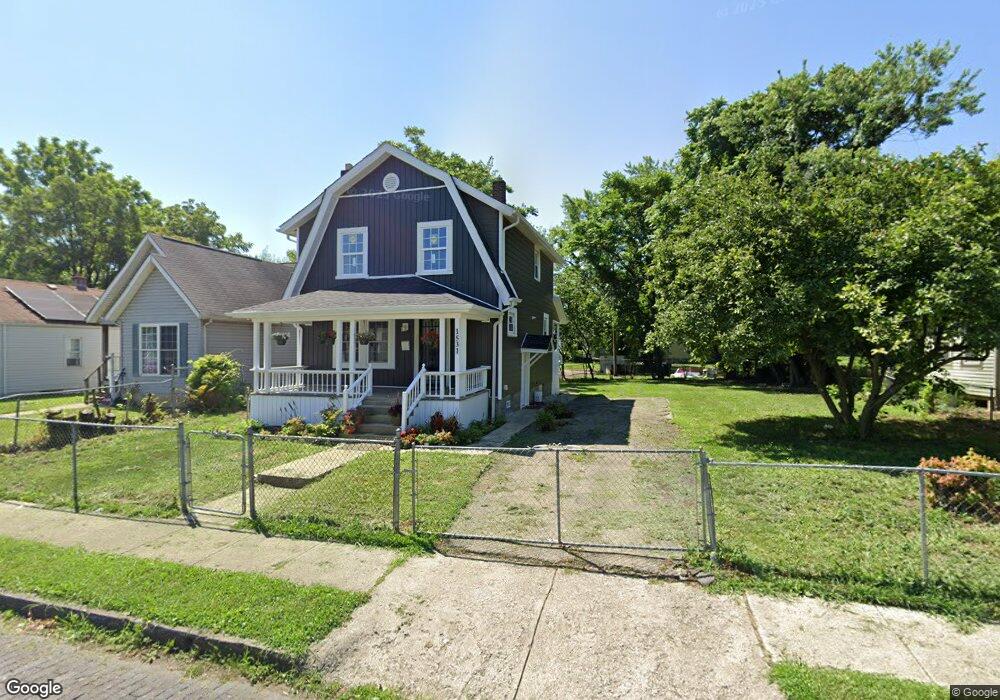
1531 E Maynard Ave Columbus, OH 43211
South Linden NeighborhoodEstimated Value: $90,000 - $148,000
3
Beds
1
Bath
1,186
Sq Ft
$109/Sq Ft
Est. Value
About This Home
This home is located at 1531 E Maynard Ave, Columbus, OH 43211 and is currently estimated at $129,737, approximately $109 per square foot. 1531 E Maynard Ave is a home located in Franklin County with nearby schools including Linden-Mckinley Stem School On Arcadia, North Columbus Preparatory Academy, and Focus Learning Academy of Central Columbus.
Ownership History
Date
Name
Owned For
Owner Type
Purchase Details
Closed on
Oct 15, 2024
Sold by
Ellison Adam Jerome and Ellison Jerome
Bought by
Carter Lesley
Current Estimated Value
Purchase Details
Closed on
Aug 31, 2023
Sold by
Ellison Randolph Constance
Bought by
Carter Lesley
Purchase Details
Closed on
Aug 12, 2023
Sold by
Weaver Cheryl Ellison
Bought by
Carter Lesley
Purchase Details
Closed on
Mar 26, 2023
Sold by
Radcliff Antonio
Bought by
Carter Lesley
Purchase Details
Closed on
Mar 8, 2023
Sold by
Ellison Stanley and Ellison Jada
Bought by
Carter Lesley
Purchase Details
Closed on
Jul 13, 1966
Bought by
Ellison Adam J and Ellison Gloria
Create a Home Valuation Report for This Property
The Home Valuation Report is an in-depth analysis detailing your home's value as well as a comparison with similar homes in the area
Home Values in the Area
Average Home Value in this Area
Purchase History
| Date | Buyer | Sale Price | Title Company |
|---|---|---|---|
| Carter Lesley | $16,800 | None Listed On Document | |
| Carter Lesley | $16,800 | None Listed On Document | |
| Carter Lesley | $16,800 | None Listed On Document | |
| Carter Lesley | $16,800 | None Listed On Document | |
| Carter Lesley | $16,800 | None Listed On Document | |
| Carter Lesley | $16,800 | None Listed On Document | |
| Carter Lesley | $16,800 | None Listed On Document | |
| Carter Lesley | $16,800 | None Listed On Document | |
| Carter Lesley | $33,600 | None Listed On Document | |
| Carter Lesley | $33,600 | None Listed On Document | |
| Ellison Adam J | -- | -- |
Source: Public Records
Tax History
| Year | Tax Paid | Tax Assessment Tax Assessment Total Assessment is a certain percentage of the fair market value that is determined by local assessors to be the total taxable value of land and additions on the property. | Land | Improvement |
|---|---|---|---|---|
| 2025 | $8,229 | $35,840 | $5,320 | $30,520 |
| 2024 | $8,229 | $35,840 | $5,320 | $30,520 |
| 2023 | $2,571 | $35,840 | $5,320 | $30,520 |
| 2022 | $5,397 | $16,700 | $2,210 | $14,490 |
| 2021 | $750 | $16,700 | $2,210 | $14,490 |
| 2020 | $602 | $16,700 | $2,210 | $14,490 |
| 2019 | $285 | $13,450 | $1,860 | $11,590 |
| 2018 | $266 | $13,450 | $1,860 | $11,590 |
| 2017 | $278 | $13,450 | $1,860 | $11,590 |
| 2016 | $272 | $12,850 | $1,680 | $11,170 |
| 2015 | $247 | $12,850 | $1,680 | $11,170 |
| 2014 | $247 | $12,850 | $1,680 | $11,170 |
| 2013 | $164 | $14,245 | $1,855 | $12,390 |
Source: Public Records
Map
Nearby Homes
- 1554 E Maynard Ave
- 1564-1566 E Blake Ave
- 2126 Cleveland Ave
- 0 E Maynard Ave
- 1672 Duxberry Ave
- 1625 Kenmore Rd
- 1608 Kenmore Rd
- 1366 Duxberry Ave
- 1363 Duxberry Ave
- 2154 Dresden St
- 1810 E 26th Ave
- 1384 E 23rd Ave
- 1481 Kohr Place
- 1430 Kenmore Rd
- 2195 Dresden St
- 1371 E 23rd Ave
- 1386 E 22nd Ave
- 1301 E 26th Ave
- 1475 E Hudson St
- 1362 Clinton St
- 1535 E Maynard Ave
- 1539 E Maynard Ave
- 1521 E Maynard Ave
- 1545 E Maynard Ave
- 1517 E Maynard Ave
- 1517 E Maynard Ave
- 1526 Duxberry Ave
- 1549 E Maynard Ave
- 1513 E Maynard Ave
- 1534 Duxberry Ave
- 1520 Duxberry Ave
- 1538 Duxberry Ave Unit 540
- 1538 Duxberry Ave Unit 40
- 1536 E Maynard Ave
- 1530 E Maynard Ave
- 1553 E Maynard Ave
- 1507 E Maynard Ave
- 1526 E Maynard Ave
- 1540 E Maynard Ave
- 1510 Duxberry Ave Unit 512
Your Personal Tour Guide
Ask me questions while you tour the home.