15341 Ebson Rd Fulton, IL 61252
Estimated Value: $219,000 - $434,000
3
Beds
2
Baths
1,860
Sq Ft
$173/Sq Ft
Est. Value
About This Home
This home is located at 15341 Ebson Rd, Fulton, IL 61252 and is currently estimated at $321,064, approximately $172 per square foot. 15341 Ebson Rd is a home located in Whiteside County with nearby schools including Fulton Elementary School, River Bend Middle School, and Fulton High School.
Ownership History
Date
Name
Owned For
Owner Type
Purchase Details
Closed on
Jan 31, 2020
Sold by
Kunau Scott M
Bought by
Scott M Kunau Ret
Current Estimated Value
Purchase Details
Closed on
Mar 20, 2018
Sold by
Kunau Nicole
Bought by
Kunau Scott
Purchase Details
Closed on
Jun 19, 2009
Sold by
Mccann Denis C and Mccann Dixie L
Bought by
Kunau Scott M and Kunan Ncole L
Home Financials for this Owner
Home Financials are based on the most recent Mortgage that was taken out on this home.
Original Mortgage
$170,000
Interest Rate
4.92%
Mortgage Type
New Conventional
Create a Home Valuation Report for This Property
The Home Valuation Report is an in-depth analysis detailing your home's value as well as a comparison with similar homes in the area
Purchase History
| Date | Buyer | Sale Price | Title Company |
|---|---|---|---|
| Scott M Kunau Ret | -- | None Available | |
| Kunau Scott | -- | -- | |
| Kunau Scott M | $245,000 | None Available |
Source: Public Records
Mortgage History
| Date | Status | Borrower | Loan Amount |
|---|---|---|---|
| Previous Owner | Kunau Scott M | $170,000 |
Source: Public Records
Tax History
| Year | Tax Paid | Tax Assessment Tax Assessment Total Assessment is a certain percentage of the fair market value that is determined by local assessors to be the total taxable value of land and additions on the property. | Land | Improvement |
|---|---|---|---|---|
| 2024 | $6,317 | $93,498 | $10,918 | $82,580 |
| 2023 | $5,870 | $86,564 | $10,108 | $76,456 |
| 2022 | $5,488 | $79,119 | $9,239 | $69,880 |
| 2021 | $5,274 | $75,187 | $8,780 | $66,407 |
| 2020 | $5,291 | $74,835 | $8,739 | $66,096 |
| 2019 | $5,388 | $75,477 | $8,814 | $66,663 |
| 2018 | $5,305 | $74,450 | $8,694 | $65,756 |
| 2017 | $5,119 | $70,985 | $8,289 | $62,696 |
| 2016 | $4,826 | $66,709 | $7,790 | $58,919 |
| 2015 | $3,955 | $57,530 | $7,590 | $49,940 |
| 2014 | $441 | $62,952 | $7,351 | $55,601 |
| 2013 | $3,955 | $57,530 | $7,590 | $49,940 |
Source: Public Records
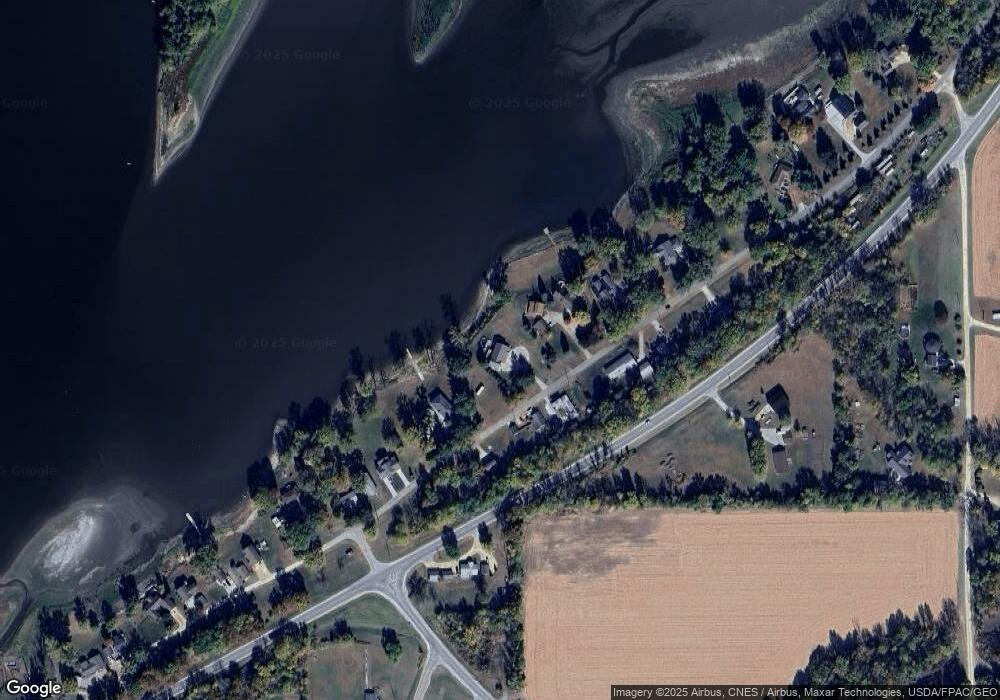
Map
Nearby Homes
- 14807 Vans Rd
- Lot 111 Garrett Ave
- Lot 110 Garrett Ave
- Lot 113 Garrett Ave
- Lot 112 Garrett Ave
- Lot 114 Garrett Ave
- 0 Holly Unit MRD12585600
- 0 Holly Unit 202601787
- 740 15th Ave S
- 552 11th Ave S
- 2410 Camanche Ave
- 259 16th Place
- 536 10th Ave S
- 5430 Holly Rd
- 508 N Bluff St
- 1408 S 10th St
- 726 10th Ave S
- 326 23rd Place
- 431 6th Ave S
- 721 S 6th St
- 15361 Ebson Rd
- 15375 Ebson Rd
- 15346 Ebson Rd
- 15340 Ebson Rd
- 15380 Ebson Rd
- 15391 Ebson Rd
- 15321 Ebson Rd
- 15291 Ebson Rd
- 15281 Ebson Rd
- 15409 Ebson Rd
- 15409 Ebson Rd
- 15280 Waller Rd
- 15261 Ebson Rd
- 15380 Waller Rd
- 15380 Waller Rd
- 3730 Garden Plain Rd
- 15451 Ebson Rd
- 15451 Ebson Rd
- 15241 Ebson Rd
- 15231 Ebson Rd
Your Personal Tour Guide
Ask me questions while you tour the home.