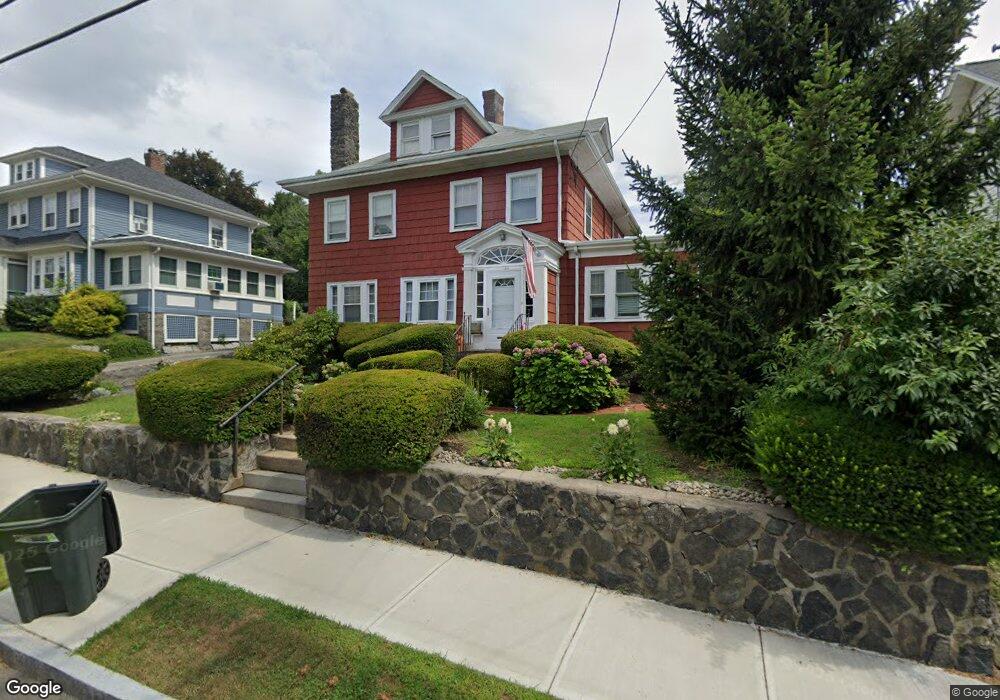
154 Putnam St Quincy, MA 02169
Quincy Center NeighborhoodEstimated Value: $880,000 - $945,233
About This Home
This home is located at 154 Putnam St, Quincy, MA 02169 and is currently estimated at $919,058, approximately $395 per square foot. 154 Putnam St is a home located in Norfolk County with nearby schools including Merrymount Elementary School, Central Middle School, and Quincy High School.
Ownership History
We collect this data history from publicly available records. To have your information removed, we recommend requesting removal directly through your county’s website.
Purchase Details
Home Values in the Area
Average Home Value in this Area
Purchase History
We collect this data history from publicly available records. To have your information removed, we recommend requesting removal directly through your county’s website.
| Date | Buyer | Sale Price | Title Company |
|---|---|---|---|
| -- | -- |
Mortgage History
We collect this data history from publicly available records. To have your information removed, we recommend requesting removal directly through your county’s website.
| Date | Status | Borrower | Loan Amount |
|---|---|---|---|
| Open | $670,500 | ||
| Closed | $158,500 | ||
| Closed | $158,000 | ||
| Closed | $160,000 |
Tax History
We collect this data history from publicly available records. To have your information removed, we recommend requesting removal directly through your county’s website.
| Year | Tax Paid | Tax Assessment Tax Assessment Total Assessment is a certain percentage of the fair market value that is determined by local assessors to be the total taxable value of land and additions on the property. | Land | Improvement |
|---|---|---|---|---|
| 2025 | $9,426 | $817,500 | $281,700 | $535,800 |
| 2024 | $8,850 | $785,300 | $268,300 | $517,000 |
| 2023 | $8,469 | $760,900 | $243,900 | $517,000 |
| 2022 | $8,701 | $726,300 | $221,700 | $504,600 |
| 2021 | $7,761 | $639,300 | $221,700 | $417,600 |
| 2020 | $8,017 | $645,000 | $211,200 | $433,800 |
| 2019 | $7,509 | $598,300 | $199,200 | $399,100 |
| 2018 | $7,792 | $584,100 | $199,200 | $384,900 |
| 2017 | $7,163 | $505,500 | $189,800 | $315,700 |
| 2016 | $6,741 | $469,400 | $180,700 | $288,700 |
| 2015 | $6,341 | $434,300 | $180,700 | $253,600 |
| 2014 | $5,889 | $396,300 | $172,100 | $224,200 |
Map
- 111 Greenleaf St
- 10 Edgemere Rd
- 44 Greenleaf St
- 126 Butler Rd
- 1 Adams St Unit 401
- 1025 Hancock St Unit 10C
- 1025 Hancock St Unit 8C
- 1025 Hancock St Unit 4J
- 1025 Hancock St Unit 14F
- 1025 Hancock St Unit 2P
- 77 Adams St Unit 210
- 77 Adams St Unit 611
- 77 Adams St Unit 610
- 77 Adams St Unit 1102
- 999 Hancock St Unit 313
- 148 Presidents Ln Unit 4
- 105 Sea St Unit 302
- 105 Sea St Unit 101
- 105 Sea St Unit 104
- 59 Spear St Unit 3
- 87 Greenleaf St
- 84 Edgemere Rd
- 83 Greenleaf St
- 76 Edgemere Rd
- 152 Putnam St
- 72 Edgemere Rd
- 154 Putnam St Unit 2
- 86 Greenleaf St Unit 202
- 86 Greenleaf St Unit 203
- 86 Greenleaf St Unit 201
- 86 Greenleaf St Unit 204
- 86 Greenleaf St Unit 302
- 86 Greenleaf St Unit 101
- 86 Greenleaf St Unit 303
- 86 Greenleaf St Unit 301
- 86 Greenleaf St Unit 304
- 103 Greenleaf St
- 75 Greenleaf St
- 68 Edgemere Rd
- 68 Edgemere Rd Unit 1
Ask me questions while you tour the home.