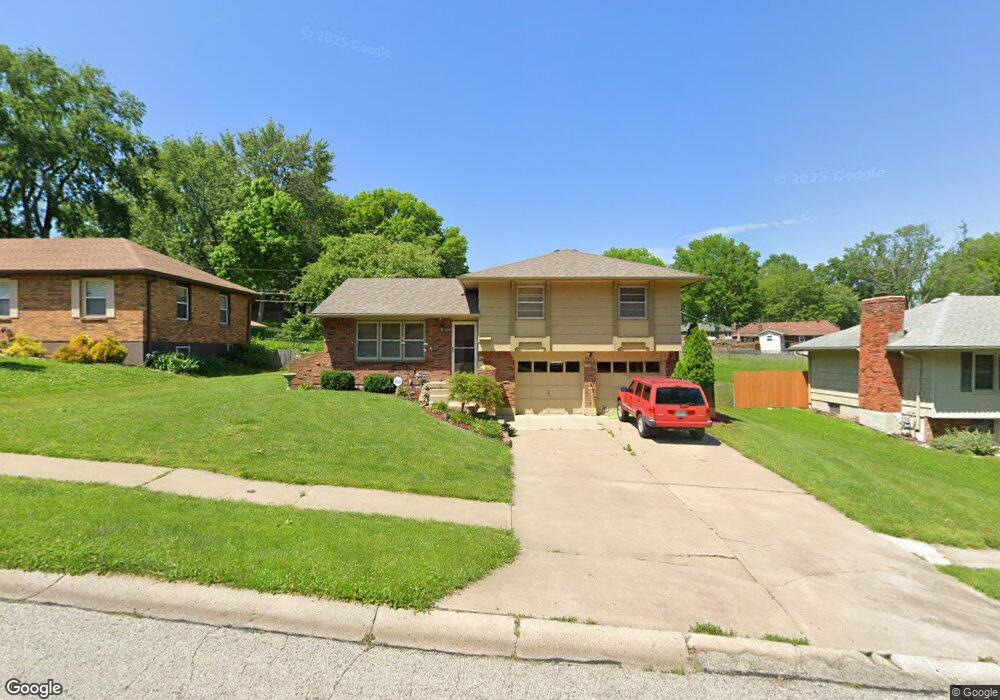
15400 E 43rd Terrace S Independence, MO 64055
Southern NeighborhoodEstimated Value: $209,086 - $241,000
3
Beds
2
Baths
1,098
Sq Ft
$204/Sq Ft
Est. Value
About This Home
This home is located at 15400 E 43rd Terrace S, Independence, MO 64055 and is currently estimated at $224,522, approximately $204 per square foot. 15400 E 43rd Terrace S is a home located in Jackson County with nearby schools including William Southern Elementary School, Bridger Middle School, and Pioneer Ridge Middle School.
Ownership History
Date
Name
Owned For
Owner Type
Purchase Details
Closed on
Oct 23, 2008
Sold by
Weatherford Brandon T and Weatherford Deanna
Bought by
Paulson James A
Current Estimated Value
Home Financials for this Owner
Home Financials are based on the most recent Mortgage that was taken out on this home.
Original Mortgage
$119,819
Outstanding Balance
$78,014
Interest Rate
6%
Mortgage Type
FHA
Estimated Equity
$146,508
Purchase Details
Closed on
Jan 22, 2003
Sold by
Fears Brian C and Fears Angela K
Bought by
Weatherford Brandon T and Weatherford Forrest
Home Financials for this Owner
Home Financials are based on the most recent Mortgage that was taken out on this home.
Original Mortgage
$99,116
Interest Rate
5.96%
Mortgage Type
FHA
Purchase Details
Closed on
Aug 17, 2000
Sold by
Jones Alan L
Bought by
Fears Brian C and Fears Angela K
Home Financials for this Owner
Home Financials are based on the most recent Mortgage that was taken out on this home.
Original Mortgage
$86,855
Interest Rate
8.15%
Mortgage Type
FHA
Create a Home Valuation Report for This Property
The Home Valuation Report is an in-depth analysis detailing your home's value as well as a comparison with similar homes in the area
Home Values in the Area
Average Home Value in this Area
Purchase History
| Date | Buyer | Sale Price | Title Company |
|---|---|---|---|
| Paulson James A | -- | Stewart Title Of Ks City Inc | |
| Weatherford Brandon T | -- | Assured Quality Title Co | |
| Fears Brian C | -- | Stewart Title |
Source: Public Records
Mortgage History
| Date | Status | Borrower | Loan Amount |
|---|---|---|---|
| Open | Paulson James A | $119,819 | |
| Previous Owner | Weatherford Brandon T | $99,116 | |
| Previous Owner | Fears Brian C | $86,855 |
Source: Public Records
Tax History
| Year | Tax Paid | Tax Assessment Tax Assessment Total Assessment is a certain percentage of the fair market value that is determined by local assessors to be the total taxable value of land and additions on the property. | Land | Improvement |
|---|---|---|---|---|
| 2025 | $1,651 | $25,196 | $4,357 | $20,839 |
| 2024 | $1,651 | $23,834 | $2,673 | $21,161 |
| 2023 | $1,614 | $23,834 | $2,622 | $21,212 |
| 2022 | $1,474 | $19,950 | $3,781 | $16,169 |
| 2021 | $1,473 | $19,950 | $3,781 | $16,169 |
| 2020 | $1,520 | $20,006 | $3,781 | $16,225 |
| 2019 | $1,496 | $20,006 | $3,781 | $16,225 |
| 2018 | $1,558 | $19,886 | $3,296 | $16,590 |
| 2017 | $1,534 | $19,886 | $3,296 | $16,590 |
| 2016 | $1,534 | $19,388 | $3,327 | $16,061 |
| 2014 | $1,457 | $18,823 | $3,230 | $15,593 |
Source: Public Records
Map
Nearby Homes
- 15504 E 44th Terrace S
- 15412 E 42nd Place
- 4228 S Stayton Ave
- 4022 S Hands Cir
- 4543 S Saville Ct
- 14930 Tomasha Dr
- 14611 E 43rd Terrace S
- 4515 S Phelps Rd
- 3912 S Christopher Cir
- 4705 S Brentwood Ave
- 4707 S Brentwood Ave
- 3904 S Stayton Ave
- 4709 S Brentwood Ave
- 4711 S Brentwood Ave
- 4712 S Brentwood Ave
- 4714 S Brentwood Ave
- 4517 S Fremont Rd
- 14700 U S 40
- 16201 E 40th St S
- 15531 E 48th St
- 15402 E 43rd Terrace S
- 15308 E 43rd Terrace S
- 15306 E 43rd Terrace S
- 15404 E 43rd Terrace S
- 15401 E 43rd Terrace S
- 15403 E 43rd Terrace S
- 15311 E 43rd Place S
- 4304 S Mills St
- 15304 E 43rd Terrace S
- 15315 E 43rd Place S
- 15305 E 43rd Terrace S
- 15307 E 43rd Place S
- 15405 E 43rd St S
- 15409 E 43rd St S
- 15406 E 43rd Terrace S
- 15319 E 43rd Place S
- 15301 E 43rd Terrace S
- 4305 S Mills St
- 15407 E 43rd Terrace S
- 15300 E 43rd Terrace S
Your Personal Tour Guide
Ask me questions while you tour the home.