Estimated Value: $309,780 - $327,000
3
Beds
3
Baths
1,460
Sq Ft
$217/Sq Ft
Est. Value
About This Home
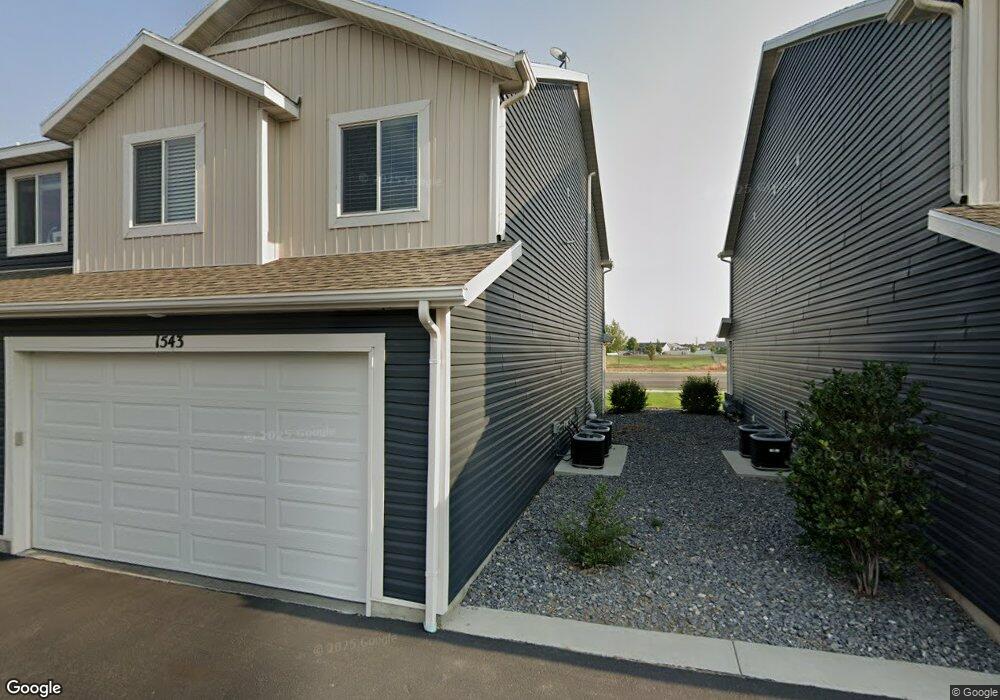
This home is located at 1543 E 320 S, Hyrum, UT 84319 and is currently estimated at $316,945, approximately $217 per square foot. 1543 E 320 S is a home located in Cache County with nearby schools including Canyon School, South Cache Middle School, and Mountain Crest High School.
Ownership History
Date
Name
Owned For
Owner Type
Purchase Details
Closed on
Jan 14, 2022
Sold by
Musacchia David B
Bought by
Infinite Income Llc
Current Estimated Value
Purchase Details
Closed on
May 26, 2021
Sold by
Merrill Nathan and Merrill Anna
Bought by
Musacchia David B and Musacchia Cherie B
Home Financials for this Owner
Home Financials are based on the most recent Mortgage that was taken out on this home.
Original Mortgage
$212,500
Interest Rate
3%
Mortgage Type
New Conventional
Purchase Details
Closed on
Nov 22, 2019
Sold by
Kartchner Homes Cv Division Inc
Bought by
Merrill Nathan and Merrill Anna
Home Financials for this Owner
Home Financials are based on the most recent Mortgage that was taken out on this home.
Original Mortgage
$194,750
Interest Rate
3.5%
Mortgage Type
New Conventional
Create a Home Valuation Report for This Property
The Home Valuation Report is an in-depth analysis detailing your home's value as well as a comparison with similar homes in the area
Home Values in the Area
Average Home Value in this Area
Purchase History
We collect this data history from publicly available records. To have your information removed, we recommend requesting removal directly through your county’s website.
| Date | Buyer | Sale Price | Title Company |
|---|---|---|---|
| Infinite Income Llc | -- | Cache Title | |
| Musacchia David B | -- | Cache Title Logan | |
| Merrill Nathan | -- | Cache Title Logan |
Source: Public Records
Mortgage History
We collect this data history from publicly available records. To have your information removed, we recommend requesting removal directly through your county’s website.
| Date | Status | Borrower | Loan Amount |
|---|---|---|---|
| Previous Owner | Musacchia David B | $212,500 | |
| Previous Owner | Merrill Nathan | $194,750 |
Source: Public Records
Tax History
| Year | Tax Paid | Tax Assessment Tax Assessment Total Assessment is a certain percentage of the fair market value that is determined by local assessors to be the total taxable value of land and additions on the property. | Land | Improvement |
|---|---|---|---|---|
| 2025 | $1,230 | $176,665 | $0 | $0 |
| 2023 | $1,369 | $175,560 | $0 | $0 |
| 2022 | $1,429 | $175,560 | $0 | $0 |
| 2021 | $1,268 | $240,000 | $70,000 | $170,000 |
| 2020 | $1,166 | $207,200 | $55,000 | $152,200 |
| 2019 | $522 | $48,000 | $48,000 | $0 |
Source: Public Records
Map
Nearby Homes
Your Personal Tour Guide
Ask me questions while you tour the home.