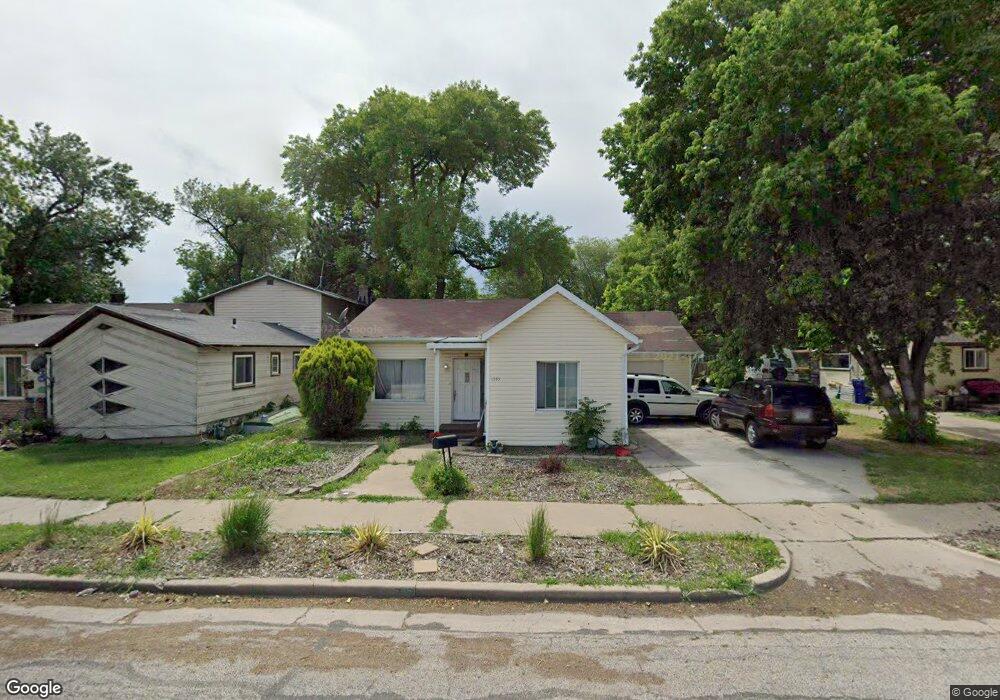
1545 Kiesel Ave Ogden, UT 84404
Mountain View NeighborhoodEstimated Value: $318,000 - $333,000
3
Beds
1
Bath
1,360
Sq Ft
$241/Sq Ft
Est. Value
About This Home
This home is located at 1545 Kiesel Ave, Ogden, UT 84404 and is currently estimated at $327,541, approximately $240 per square foot. 1545 Kiesel Ave is a home located in Weber County with nearby schools including Heritage Elementary School, Mound Fort Junior High School, and Ben Lomond High School.
Ownership History
Date
Name
Owned For
Owner Type
Purchase Details
Closed on
Dec 6, 2022
Sold by
Catamount Properties 2018 Llc
Bought by
Neemia Faasalele
Current Estimated Value
Home Financials for this Owner
Home Financials are based on the most recent Mortgage that was taken out on this home.
Original Mortgage
$304,286
Outstanding Balance
$295,371
Interest Rate
7.08%
Mortgage Type
FHA
Estimated Equity
$32,170
Purchase Details
Closed on
May 16, 2022
Sold by
French Linda R
Bought by
Catamount Properties 2018 Llc
Purchase Details
Closed on
May 11, 2011
Sold by
Federal National Mortgage Association
Bought by
French Linda R
Purchase Details
Closed on
Feb 18, 2011
Sold by
Mendoza Ruben C
Bought by
Federal National Mortgage Association
Purchase Details
Closed on
Jun 11, 2001
Sold by
Robinson Willye and Jones Willie L
Bought by
Mendoza Ruben C
Home Financials for this Owner
Home Financials are based on the most recent Mortgage that was taken out on this home.
Original Mortgage
$72,069
Interest Rate
7.14%
Mortgage Type
FHA
Create a Home Valuation Report for This Property
The Home Valuation Report is an in-depth analysis detailing your home's value as well as a comparison with similar homes in the area
Home Values in the Area
Average Home Value in this Area
Purchase History
We collect this data history from publicly available records. To have your information removed, we recommend requesting removal directly through your county’s website.
| Date | Buyer | Sale Price | Title Company |
|---|---|---|---|
| Neemia Faasalele | -- | Security Title | |
| Catamount Properties 2018 Llc | -- | None Listed On Document | |
| French Linda R | $50,000 | Us Title Insurance Agency | |
| Federal National Mortgage Association | $70,225 | Accommodation | |
| Mendoza Ruben C | -- | Weber Title |
Source: Public Records
Mortgage History
We collect this data history from publicly available records. To have your information removed, we recommend requesting removal directly through your county’s website.
| Date | Status | Borrower | Loan Amount |
|---|---|---|---|
| Open | Neemia Faasalele | $304,286 | |
| Previous Owner | Mendoza Ruben C | $72,069 | |
| Closed | Neemia Faasalele | $10,000 |
Source: Public Records
Tax History
| Year | Tax Paid | Tax Assessment Tax Assessment Total Assessment is a certain percentage of the fair market value that is determined by local assessors to be the total taxable value of land and additions on the property. | Land | Improvement |
|---|---|---|---|---|
| 2025 | $2,103 | $308,281 | $100,362 | $207,919 |
| 2024 | $1,966 | $155,649 | $55,206 | $100,443 |
| 2023 | $2,036 | $162,250 | $53,626 | $108,624 |
| 2022 | $2,045 | $297,000 | $77,997 | $219,003 |
| 2021 | $1,780 | $236,000 | $52,841 | $183,159 |
| 2020 | $1,510 | $185,000 | $37,261 | $147,739 |
| 2019 | $965 | $111,000 | $32,180 | $78,820 |
| 2018 | $788 | $90,000 | $27,136 | $62,864 |
| 2017 | $712 | $76,000 | $24,915 | $51,085 |
| 2016 | $642 | $37,059 | $11,450 | $25,609 |
| 2015 | $645 | $36,332 | $11,450 | $24,882 |
| 2014 | $513 | $28,362 | $10,029 | $18,333 |
Source: Public Records
Map
Nearby Homes
- 1668 Kiesel Ave
- 1504 Washington Blvd
- 422 16th St
- 1454 S 410 E Unit 137
- 430 E 1435 S Unit 130
- 434 E 1435 S Unit 129
- 443 E 1415 S Unit 118
- 501 Canyon Rd
- 510 Canyon Rd
- 449 13th St
- 506 14th St
- 1325 Lincoln Ave Unit 44
- 1325 Lincoln Ave Unit 110
- 1529 Jefferson Ave
- 2122 S Jefferson Ave
- 1424 Jefferson Ave
- 1945 Maple Grove Way
- 1987 Birch Cove St
- 1279 S 985 E
- 1267 S 985 St E
- 1539 Kiesel Ave
- 1601 Kiesel Ave
- 1533 Kiesel Ave
- 1607 Kiesel Ave
- 1527 Kiesel Ave
- 1546 Grant Ave
- 1548 Grant Ave
- 1615 Kiesel Ave
- 1538 Grant Ave
- 1552 Grant Ave
- 1521 Kiesel Ave
- 1558 Grant Ave
- 1540 Kiesel Ave
- 1619 Kiesel Ave
- 1530 Grant Ave
- 1620 Grant Ave
- 1610 Kiesel Ave
- 1524 Grant Ave
- 1524 Kiesel Ave
- 1612 Kiesel Ave
Your Personal Tour Guide
Ask me questions while you tour the home.