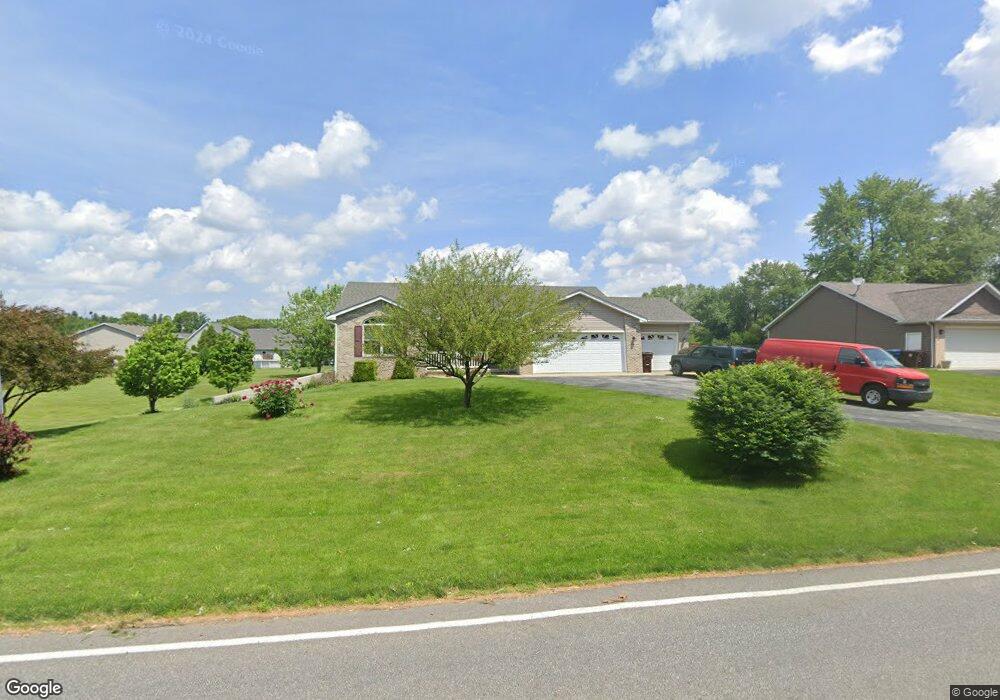
155 E 400 S Valparaiso, IN 46383
Porter County NeighborhoodEstimated Value: $380,000 - $413,000
2
Beds
2
Baths
1,420
Sq Ft
$274/Sq Ft
Est. Value
About This Home
This home is located at 155 E 400 S, Valparaiso, IN 46383 and is currently estimated at $389,251, approximately $274 per square foot. 155 E 400 S is a home located in Porter County with nearby schools including Morgan Township Elementary School, Morgan Township Middle/High School, and Midwest Academy.
Ownership History
Date
Name
Owned For
Owner Type
Purchase Details
Closed on
Apr 14, 2006
Sold by
Freyenberger Aaron
Bought by
Stanley James L and Stanley Lava R
Current Estimated Value
Home Financials for this Owner
Home Financials are based on the most recent Mortgage that was taken out on this home.
Original Mortgage
$50,000
Outstanding Balance
$28,128
Interest Rate
6.48%
Mortgage Type
Fannie Mae Freddie Mac
Estimated Equity
$361,123
Create a Home Valuation Report for This Property
The Home Valuation Report is an in-depth analysis detailing your home's value as well as a comparison with similar homes in the area
Home Values in the Area
Average Home Value in this Area
Purchase History
We collect this data history from publicly available records. To have your information removed, we recommend requesting removal directly through your county’s website.
| Date | Buyer | Sale Price | Title Company |
|---|---|---|---|
| Stanley James L | -- | Ticor Title Insurance |
Source: Public Records
Mortgage History
We collect this data history from publicly available records. To have your information removed, we recommend requesting removal directly through your county’s website.
| Date | Status | Borrower | Loan Amount |
|---|---|---|---|
| Open | Stanley James L | $50,000 |
Source: Public Records
Tax History
| Year | Tax Paid | Tax Assessment Tax Assessment Total Assessment is a certain percentage of the fair market value that is determined by local assessors to be the total taxable value of land and additions on the property. | Land | Improvement |
|---|---|---|---|---|
| 2025 | $2,849 | $393,900 | $80,600 | $313,300 |
| 2024 | $2,641 | $413,700 | $48,600 | $365,100 |
| 2023 | $2,501 | $373,000 | $42,700 | $330,300 |
| 2022 | $2,428 | $337,900 | $42,700 | $295,200 |
| 2021 | $2,335 | $300,100 | $42,700 | $257,400 |
| 2020 | $2,084 | $272,700 | $36,800 | $235,900 |
| 2019 | $2,019 | $256,800 | $36,800 | $220,000 |
| 2018 | $1,900 | $246,900 | $36,800 | $210,100 |
| 2017 | $1,860 | $245,500 | $36,800 | $208,700 |
| 2016 | $1,234 | $177,300 | $37,600 | $139,700 |
| 2014 | $1,224 | $173,400 | $36,400 | $137,000 |
| 2013 | -- | $165,800 | $36,800 | $129,000 |
Source: Public Records
Map
Nearby Homes
- 373 S State Road 49
- 158 E 250 S
- 6775 E 103rd Ln
- 165 E 600 S
- 351 S 100 W
- 186 Buckskin Ln
- 11 Stoner Dr
- 92 E 30 S
- 0 Smoke Rd
- 764 Blackstone Ct
- 709 Blackstone Ct
- 474 S 200 W
- 204 N Main St
- 31 Smoke Rd
- Lot B4-5 St Road 8
- 203 E Indiana Ave
- 48 E Division Rd
- 81 E Division Rd
- 2106 Arrow Leaf Ln
- 403 Creekwood Dr
Your Personal Tour Guide
Ask me questions while you tour the home.