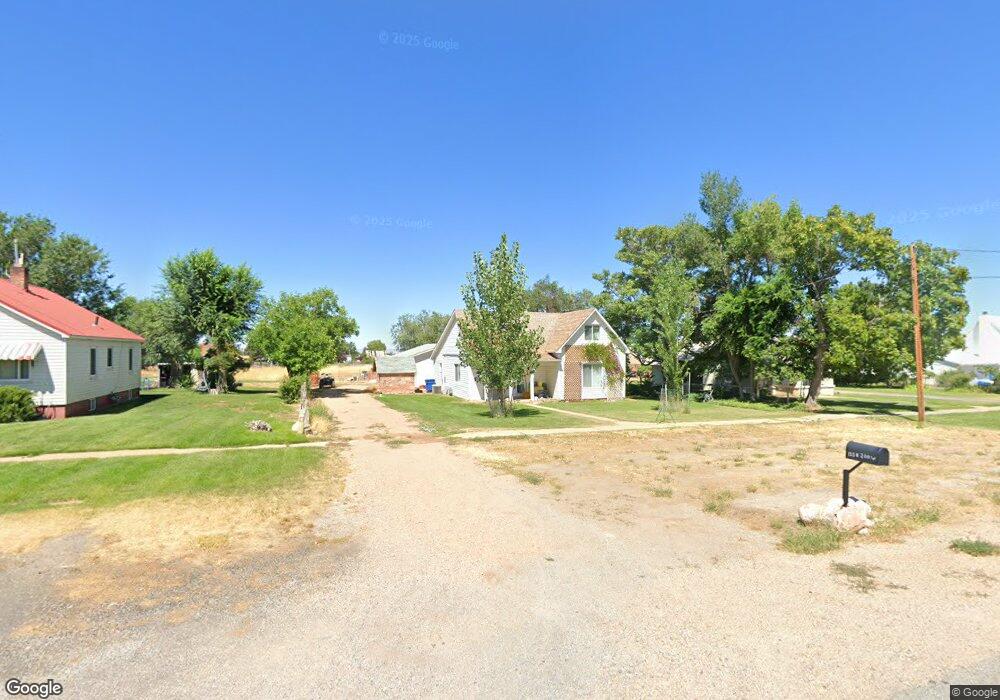
155 N 200 W Fillmore, UT 84631
Estimated Value: $244,000 - $379,000
3
Beds
1
Bath
1,344
Sq Ft
$213/Sq Ft
Est. Value
About This Home
This home is located at 155 N 200 W, Fillmore, UT 84631 and is currently estimated at $286,123, approximately $212 per square foot. 155 N 200 W is a home located in Millard County.
Ownership History
Date
Name
Owned For
Owner Type
Purchase Details
Closed on
Oct 6, 2025
Sold by
Newitt Ida F
Bought by
Newitt Family Trust and Newitt
Current Estimated Value
Purchase Details
Closed on
Jan 14, 2021
Sold by
Pacheco Lauri Jean Fowler
Bought by
Millard Burbank
Home Financials for this Owner
Home Financials are based on the most recent Mortgage that was taken out on this home.
Original Mortgage
$145,500
Interest Rate
2.71%
Mortgage Type
New Conventional
Create a Home Valuation Report for This Property
The Home Valuation Report is an in-depth analysis detailing your home's value as well as a comparison with similar homes in the area
Home Values in the Area
Average Home Value in this Area
Purchase History
| Date | Buyer | Sale Price | Title Company |
|---|---|---|---|
| Newitt Family Trust | -- | None Listed On Document | |
| Millard Burbank | -- | First American Title |
Source: Public Records
Mortgage History
| Date | Status | Borrower | Loan Amount |
|---|---|---|---|
| Previous Owner | Millard Burbank | $145,500 |
Source: Public Records
Tax History
| Year | Tax Paid | Tax Assessment Tax Assessment Total Assessment is a certain percentage of the fair market value that is determined by local assessors to be the total taxable value of land and additions on the property. | Land | Improvement |
|---|---|---|---|---|
| 2025 | $1,025 | $128,719 | $33,086 | $95,633 |
| 2024 | $1,025 | $98,430 | $25,596 | $72,834 |
| 2023 | $1,088 | $98,430 | $25,596 | $72,834 |
| 2022 | $950 | $85,280 | $23,269 | $62,011 |
| 2021 | $809 | $69,739 | $15,110 | $54,629 |
| 2020 | $748 | $64,822 | $13,736 | $51,086 |
| 2019 | $647 | $56,277 | $13,736 | $42,541 |
| 2018 | $619 | $55,077 | $13,736 | $41,341 |
| 2017 | $575 | $48,646 | $13,736 | $34,910 |
| 2016 | $550 | $48,646 | $13,736 | $34,910 |
| 2015 | $550 | $48,646 | $13,736 | $34,910 |
| 2014 | -- | $48,646 | $13,736 | $34,910 |
| 2013 | -- | $48,646 | $13,736 | $34,910 |
Source: Public Records
Map
Nearby Homes
- 225 W 200 St N
- 245 W 300 N
- 75 N 100 West St
- 155 W Center St
- 335 W 400 North St
- 390 N 100 W
- 351 W 100 South St
- 260 W 200 S
- 40 S 100 Rd E
- 410 W 400 N
- 310 S 500 West Rd
- 220 S 200 E
- 465 S 100 W
- 155 E 500 St S
- 157 E 500 South St
- 405 E 500 St S
- 2155 N Cedar Mountain Rd
- 2835 N Cedar Mountain Rd
- 760 E 700 St S
- 690 E 500 S
Your Personal Tour Guide
Ask me questions while you tour the home.