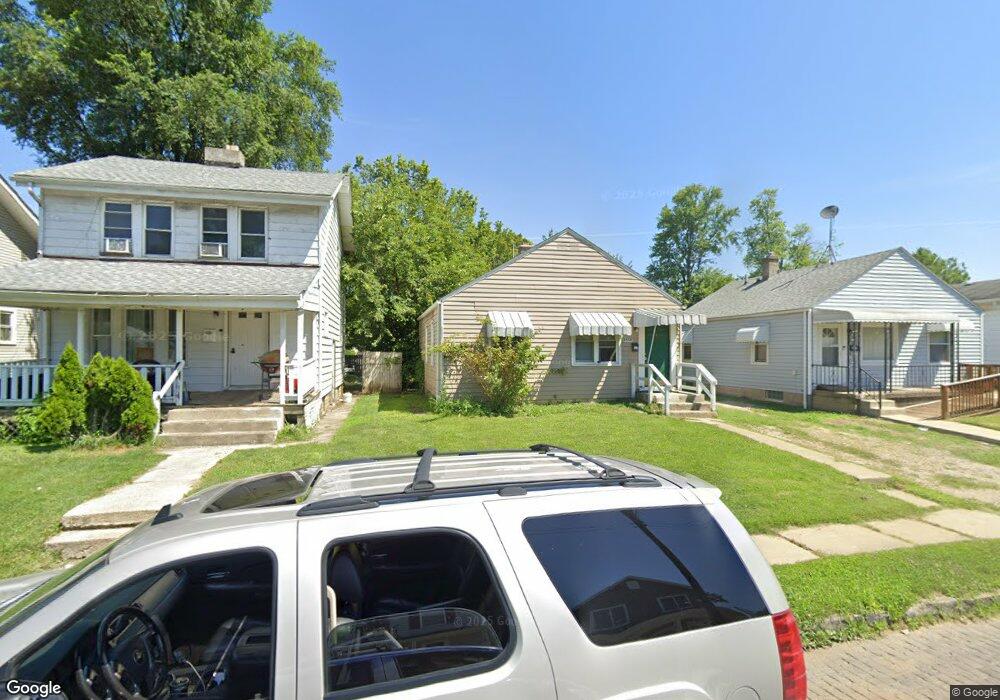
1558 E Maynard Ave Columbus, OH 43211
South Linden NeighborhoodEstimated Value: $106,192 - $118,000
2
Beds
1
Bath
672
Sq Ft
$169/Sq Ft
Est. Value
About This Home
This home is located at 1558 E Maynard Ave, Columbus, OH 43211 and is currently estimated at $113,298, approximately $168 per square foot. 1558 E Maynard Ave is a home located in Franklin County with nearby schools including Linden STEM Academy (K-6), Linden-Mckinley Stem School On Arcadia, and North Columbus Preparatory Academy.
Ownership History
Date
Name
Owned For
Owner Type
Purchase Details
Closed on
Jun 13, 2018
Sold by
Alabi Sam
Bought by
Alabi Samuel Adisa and Rosanwo Adetutu Ebun
Current Estimated Value
Purchase Details
Closed on
Nov 23, 1992
Bought by
Alabi Sam
Purchase Details
Closed on
Aug 27, 1992
Create a Home Valuation Report for This Property
The Home Valuation Report is an in-depth analysis detailing your home's value as well as a comparison with similar homes in the area
Home Values in the Area
Average Home Value in this Area
Purchase History
| Date | Buyer | Sale Price | Title Company |
|---|---|---|---|
| Alabi Samuel Adisa | -- | None Available | |
| Alabi Sam | -- | -- | |
| -- | -- | -- |
Source: Public Records
Tax History
| Year | Tax Paid | Tax Assessment Tax Assessment Total Assessment is a certain percentage of the fair market value that is determined by local assessors to be the total taxable value of land and additions on the property. | Land | Improvement |
|---|---|---|---|---|
| 2025 | $1,067 | $23,280 | $5,320 | $17,960 |
| 2024 | $1,067 | $23,280 | $5,320 | $17,960 |
| 2023 | $1,054 | $23,275 | $5,320 | $17,955 |
| 2022 | $276 | $5,190 | $2,210 | $2,980 |
| 2021 | $367 | $5,190 | $2,210 | $2,980 |
| 2020 | $277 | $5,190 | $2,210 | $2,980 |
| 2019 | $262 | $4,210 | $1,860 | $2,350 |
| 2018 | $131 | $4,210 | $1,860 | $2,350 |
| 2017 | $262 | $4,210 | $1,860 | $2,350 |
| 2016 | $565 | $7,880 | $2,210 | $5,670 |
| 2015 | $308 | $7,880 | $2,210 | $5,670 |
| 2014 | $489 | $7,880 | $2,210 | $5,670 |
| 2013 | $268 | $8,750 | $2,450 | $6,300 |
Source: Public Records
Map
Nearby Homes
- 1554 E Maynard Ave
- 1564-1566 E Blake Ave
- 2126 Cleveland Ave
- 1625 Kenmore Rd
- 0 E Maynard Ave
- 1608 Kenmore Rd
- 1672 Duxberry Ave
- 1481 Kohr Place
- 2154 Dresden St
- 1366 Duxberry Ave
- 1363 Duxberry Ave
- 1430 Kenmore Rd
- 1810 E 26th Ave
- 2195 Dresden St
- 2305 Cleveland Ave
- 1475 E Hudson St
- 1362 Clinton St
- 1384 E 23rd Ave
- 1301 E 26th Ave
- 1371 E 23rd Ave
- 1564 E Maynard Ave
- 1550 E Maynard Ave
- 1546 E Maynard Ave
- 1572 E Maynard Ave Unit 580
- 1563 E Blake Ave
- 1540 E Maynard Ave
- 1559-6 E Blake Ave Unit 2
- 1559 E Blake Ave Unit 561
- 1559-1561 E Blake Ave
- 1569 E Blake Ave
- 1555 E Blake Ave
- 1573 E Blake Ave
- 1549 E Blake Ave Unit 551
- 1553 E Maynard Ave
- 1557 E Maynard Ave
- 1582 E Maynard Ave
- 1536 E Maynard Ave
- 1549 E Maynard Ave
- 1545 E Maynard Ave
- 1545 E Blake Ave
Your Personal Tour Guide
Ask me questions while you tour the home.