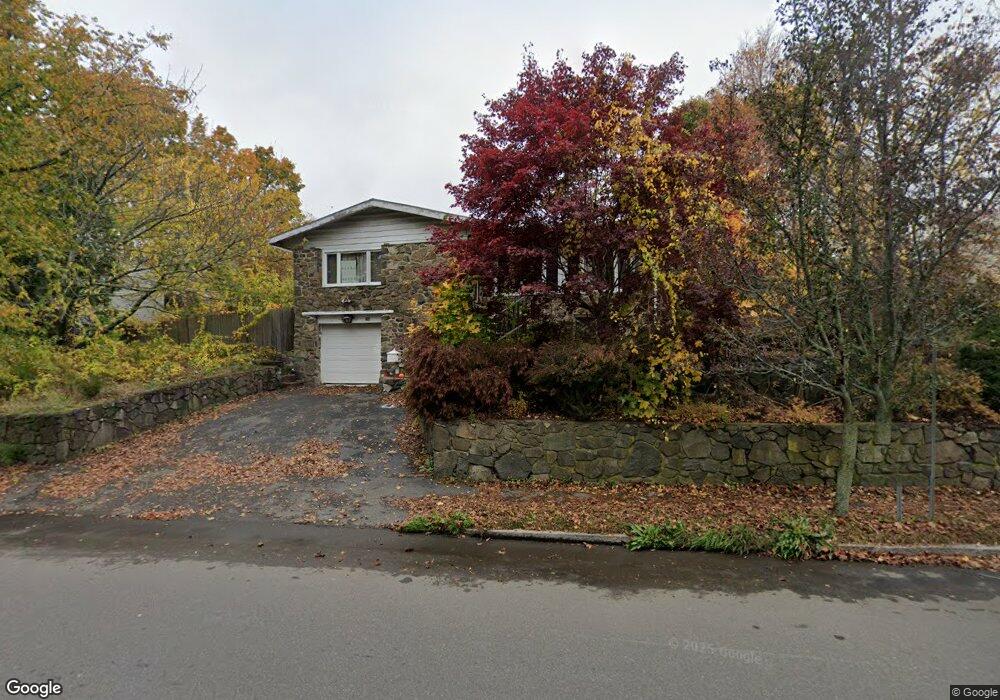
156 W Shore Dr Marblehead, MA 01945
Estimated Value: $776,891 - $1,042,000
3
Beds
2
Baths
1,619
Sq Ft
$548/Sq Ft
Est. Value
About This Home
This home is located at 156 W Shore Dr, Marblehead, MA 01945 and is currently estimated at $887,723, approximately $548 per square foot. 156 W Shore Dr is a home located in Essex County with nearby schools including Marblehead High School, Marblehead Community Charter Public School, and Tower School.
Ownership History
Date
Name
Owned For
Owner Type
Purchase Details
Closed on
Mar 29, 2010
Sold by
Hamson Dennis E and Hamson Debra A
Bought by
Campbell Sim
Current Estimated Value
Home Financials for this Owner
Home Financials are based on the most recent Mortgage that was taken out on this home.
Original Mortgage
$308,312
Interest Rate
5.5%
Mortgage Type
FHA
Purchase Details
Closed on
Feb 9, 2009
Sold by
Hamson Edward B
Bought by
Hamson Dennis E
Create a Home Valuation Report for This Property
The Home Valuation Report is an in-depth analysis detailing your home's value as well as a comparison with similar homes in the area
Home Values in the Area
Average Home Value in this Area
Purchase History
We collect this data history from publicly available records. To have your information removed, we recommend requesting removal directly through your county’s website.
| Date | Buyer | Sale Price | Title Company |
|---|---|---|---|
| Campbell Sim | $314,000 | -- | |
| Hamson Dennis E | -- | -- | |
| Hamson Edward B | -- | -- |
Source: Public Records
Mortgage History
We collect this data history from publicly available records. To have your information removed, we recommend requesting removal directly through your county’s website.
| Date | Status | Borrower | Loan Amount |
|---|---|---|---|
| Open | Hamson Edward B | $301,000 | |
| Closed | Hamson Edward B | $304,000 | |
| Closed | Hamson Edward B | $308,312 |
Source: Public Records
Tax History
| Year | Tax Paid | Tax Assessment Tax Assessment Total Assessment is a certain percentage of the fair market value that is determined by local assessors to be the total taxable value of land and additions on the property. | Land | Improvement |
|---|---|---|---|---|
| 2025 | $6,508 | $719,100 | $523,000 | $196,100 |
| 2024 | $5,634 | $628,800 | $509,900 | $118,900 |
| 2023 | $6,106 | $610,600 | $490,300 | $120,300 |
| 2022 | $5,639 | $536,000 | $405,300 | $130,700 |
| 2021 | $5,191 | $498,200 | $366,100 | $132,100 |
| 2020 | $5,045 | $485,600 | $392,300 | $93,300 |
| 2019 | $4,934 | $459,400 | $366,100 | $93,300 |
| 2018 | $4,486 | $407,100 | $313,800 | $93,300 |
| 2017 | $4,626 | $420,200 | $326,900 | $93,300 |
| 2016 | $4,278 | $385,400 | $287,700 | $97,700 |
| 2015 | $3,976 | $358,800 | $261,500 | $97,300 |
| 2014 | $3,801 | $342,700 | $248,400 | $94,300 |
Source: Public Records
Map
Nearby Homes
- 2 Girdler Rd
- 189 W Shore Dr
- 197A W Shore Dr Unit A
- 72 Village St
- 27 Maverick St
- 78 Garfield St
- 9 Mount Vernon St
- 82 Cornell Rd
- 3 Devereux Terrace
- 53 Sewall St
- 1 Maverick St Unit 2
- 282 Pleasant St
- 5 Ramsay Rd
- 290 Washington St Unit 2
- 126 Pleasant St
- 40 Prospect St Unit 3
- 2 Commercial St Unit 3
- 149 Elm St
- 14 Central St Unit B
- 16 Liberty Rd
- 152 W Shore Dr
- 160 W Shore Dr
- 161 W Shore Dr
- 150 W Shore Dr
- 5 Lorraine Terrace
- 153 W Shore Dr
- 11 Lorraine Terrace
- 165 W Shore Dr
- 7 Lorraine Terrace
- 15 Lorraine Terrace
- 15 Hawthorn Rd
- 151 W Shore Dr
- 17 Lorraine Terrace
- 17 Hawthorn Rd
- 167 W Shore Dr
- 11 Hawthorn Rd
- 12 Lorraine Terrace
- 19 Lorraine Terrace
- 144 W Shore Dr
- 23 Hawthorn Rd
Your Personal Tour Guide
Ask me questions while you tour the home.