15718 Garlang St Channelview, TX 77530
Estimated Value: $142,000 - $212,000
About This Home
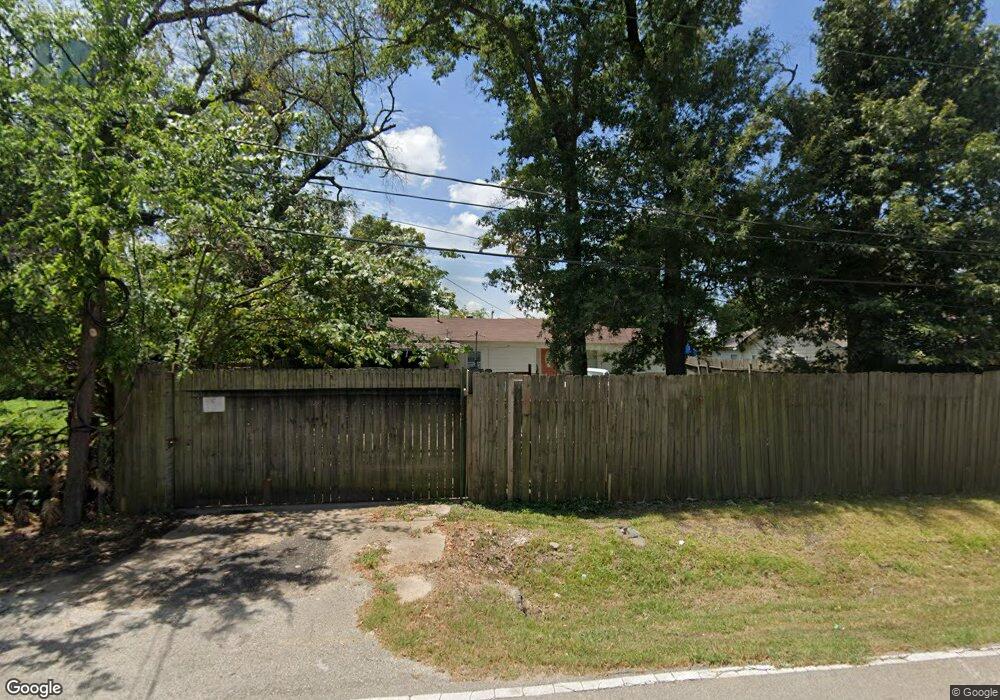
This home is located at 15718 Garlang St, Channelview, TX 77530 and is currently estimated at $175,138, approximately $154 per square foot. 15718 Garlang St is a home located in Harris County with nearby schools including Channelview High School and Family Christian Academy.
Ownership History
We collect this data history from publicly available records. To have your information removed, we recommend requesting removal directly through your county’s website.
Purchase Details
Home Financials for this Owner
Home Financials are based on the most recent Mortgage that was taken out on this home.Purchase Details
Purchase Details
Home Values in the Area
Average Home Value in this Area
Purchase History
We collect this data history from publicly available records. To have your information removed, we recommend requesting removal directly through your county’s website.
| Date | Buyer | Sale Price | Title Company |
|---|---|---|---|
| -- | None Available | ||
| -- | None Available | ||
| -- | None Available |
Mortgage History
We collect this data history from publicly available records. To have your information removed, we recommend requesting removal directly through your county’s website.
| Date | Status | Borrower | Loan Amount |
|---|---|---|---|
| Previous Owner | $95,000 |
Tax History
We collect this data history from publicly available records. To have your information removed, we recommend requesting removal directly through your county’s website.
| Year | Tax Paid | Tax Assessment Tax Assessment Total Assessment is a certain percentage of the fair market value that is determined by local assessors to be the total taxable value of land and additions on the property. | Land | Improvement |
|---|---|---|---|---|
| 2025 | $1,043 | $98,719 | $55,865 | $42,854 |
| 2024 | $913 | $81,000 | $23,522 | $57,478 |
| 2023 | $913 | $82,674 | $23,522 | $59,152 |
| 2022 | $1,924 | $82,674 | $23,522 | $59,152 |
| 2021 | $1,331 | $54,933 | $17,642 | $37,291 |
| 2020 | $827 | $32,207 | $5,292 | $26,915 |
| 2019 | $846 | $32,207 | $5,292 | $26,915 |
| 2018 | $450 | $32,207 | $5,292 | $26,915 |
| 2017 | $847 | $32,207 | $5,292 | $26,915 |
| 2016 | $847 | $32,207 | $5,292 | $26,915 |
| 2015 | $865 | $32,207 | $5,292 | $26,915 |
| 2014 | $865 | $32,207 | $5,292 | $26,915 |
Map
- 15627 Market St
- 15627 S Brentwood St
- 15603 N Brentwood St
- 809 Norell St
- 822 Woodhue St
- 15709 Woodforest Blvd
- 730 Barnesville St
- 710 Knob Hollow St
- 16935 Market St
- 814 Kilpatrick St
- 803 Knob Hollow St
- TBD E Freeway Service Rd
- 621 Elsbeth St
- 722 Canna St
- 16526 Market St
- 908 Lakeside Dr
- 16534 Market St
- 829 Becker St
- 730 Stonyridge St
- 15454 Arce Rojo St
- 15716 Garlang St
- 15720 Garlang St
- 15714 Garlang St
- 15724 Garlang St
- 15712 Garlang St
- 15719 Garlang St
- 15721 Garlang St
- 15710 Garlang St
- 15715 Garlang St
- 15723 Garlang St
- 15726 Garlang St
- 15713 Garlang St
- 15727 Garlang St
- 15708 Garlang St
- 15711 Garlang St
- 15709 Garlang St
- 15706 Garlang St
- 309 Sheldon Rd
- 15735 Market St Unit 3
- 15735 Market St Unit 1
Ask me questions while you tour the home.