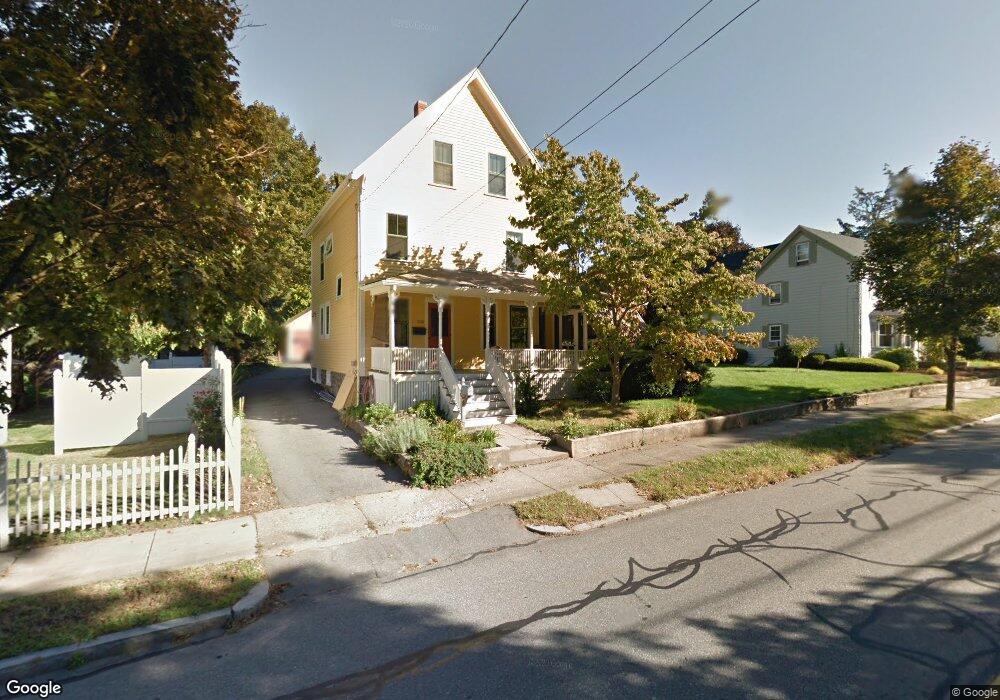
159 Broadway St Wakefield, MA 01880
West Side NeighborhoodEstimated Value: $739,000 - $822,323
4
Beds
2
Baths
1,826
Sq Ft
$433/Sq Ft
Est. Value
About This Home
This home is located at 159 Broadway St, Wakefield, MA 01880 and is currently estimated at $790,081, approximately $432 per square foot. 159 Broadway St is a home located in Middlesex County with nearby schools including Wakefield Memorial High School, St Joseph School, and St. Patrick Elementary School.
Ownership History
Date
Name
Owned For
Owner Type
Purchase Details
Closed on
Mar 24, 2010
Sold by
Innerfield Barry and Dovydenas Liuda
Bought by
159 Broadway Rt
Current Estimated Value
Purchase Details
Closed on
Mar 27, 1981
Bought by
159 Broadway Rt
Create a Home Valuation Report for This Property
The Home Valuation Report is an in-depth analysis detailing your home's value as well as a comparison with similar homes in the area
Home Values in the Area
Average Home Value in this Area
Purchase History
We collect this data history from publicly available records. To have your information removed, we recommend requesting removal directly through your county’s website.
| Date | Buyer | Sale Price | Title Company |
|---|---|---|---|
| 159 Broadway Rt | -- | -- | |
| 159 Broadway Rt | $65,000 | -- |
Source: Public Records
Mortgage History
We collect this data history from publicly available records. To have your information removed, we recommend requesting removal directly through your county’s website.
| Date | Status | Borrower | Loan Amount |
|---|---|---|---|
| Open | 159 Broadway Rt | $216,500 | |
| Previous Owner | 159 Broadway Rt | $217,000 | |
| Previous Owner | 159 Broadway Rt | $96,650 | |
| Previous Owner | 159 Broadway Rt | $130,500 |
Source: Public Records
Tax History
| Year | Tax Paid | Tax Assessment Tax Assessment Total Assessment is a certain percentage of the fair market value that is determined by local assessors to be the total taxable value of land and additions on the property. | Land | Improvement |
|---|---|---|---|---|
| 2025 | $7,957 | $701,100 | $363,700 | $337,400 |
| 2024 | $7,842 | $697,100 | $361,600 | $335,500 |
| 2023 | $7,463 | $636,200 | $329,700 | $306,500 |
| 2022 | $7,146 | $580,000 | $300,300 | $279,700 |
| 2021 | $7,080 | $556,200 | $279,900 | $276,300 |
| 2020 | $6,640 | $520,000 | $261,700 | $258,300 |
| 2019 | $6,342 | $494,300 | $248,800 | $245,500 |
| 2018 | $5,908 | $456,200 | $229,500 | $226,700 |
| 2017 | $5,555 | $426,300 | $214,500 | $211,800 |
| 2016 | $5,431 | $402,600 | $202,900 | $199,700 |
| 2015 | $5,075 | $376,500 | $189,600 | $186,900 |
| 2014 | $4,629 | $362,200 | $182,300 | $179,900 |
Source: Public Records
Map
Nearby Homes
- 5 Ballister St Unit 523
- 293 Albion St
- 7 Ballister St Unit 428
- 248 Albion St Unit 324
- 248 Albion St Unit 315
- 62 Foundry St Unit 312
- 62 Foundry St Unit 505
- 62 Foundry St Unit 202
- 346 Albion St
- 175 North Ave Unit 407
- 3 Walnut St
- 50 Albion St
- 269 Green St
- 47 Winship Dr
- 44 Church St
- 1 Traverse St Unit E
- 19 Wakefield Ave
- 13 Parker Rd
- 4 Wakefield Ave Unit 4
- 48 N Emerson St Unit 1
- 161 Broadway St
- 155 Broadway St
- 155 Broadway St Unit 1
- 3 Nelly St
- 3 Nelly St Unit B
- 3 Nelly St Unit A
- 162 Broadway St
- 5 Nelly St
- 151 Broadway St
- 151 Broadway St
- 151 Broadway St Unit 1
- 151 Broadway St Unit A
- 151 Broadway St Unit B
- 24 Bartley St
- 160 Broadway St
- 2 Nelly St
- 149 Broadway St
- 26 Bartley St
- 158 Broadway St
- 158 Broadway St Unit 1
Your Personal Tour Guide
Ask me questions while you tour the home.