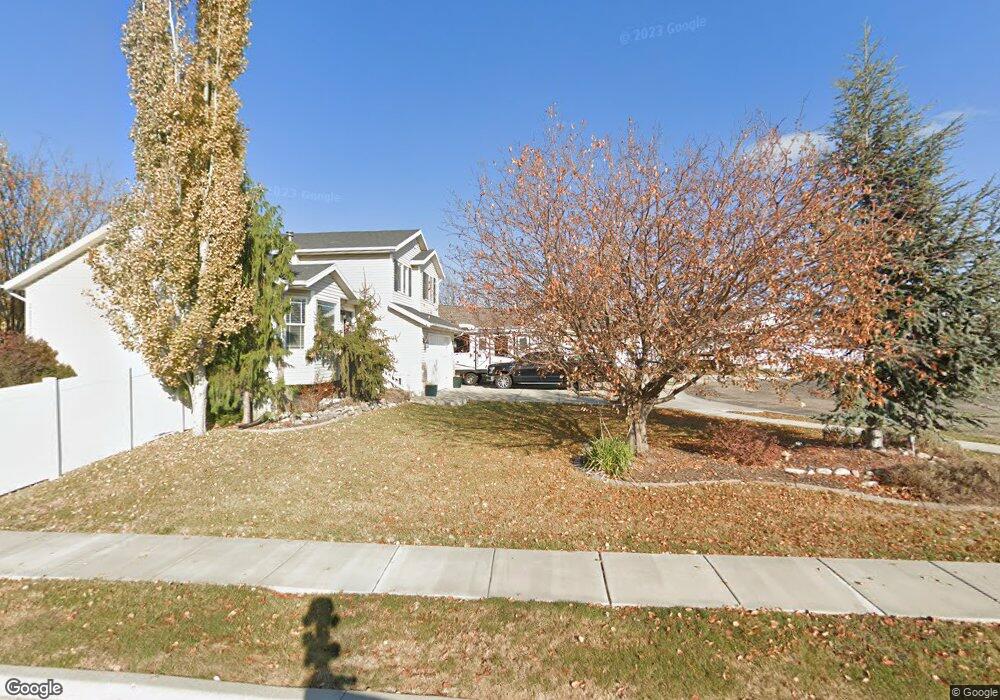
159 E 2275 S Clearfield, UT 84015
Estimated Value: $503,000 - $548,000
4
Beds
4
Baths
2,682
Sq Ft
$199/Sq Ft
Est. Value
About This Home
This home is located at 159 E 2275 S, Clearfield, UT 84015 and is currently estimated at $533,056, approximately $198 per square foot. 159 E 2275 S is a home located in Davis County with nearby schools including Antelope Elementary School, North Davis Junior High School, and Clearfield High School.
Ownership History
Date
Name
Owned For
Owner Type
Purchase Details
Closed on
Aug 1, 2022
Sold by
Anderson Ashley M
Bought by
Anderson Ashley M
Current Estimated Value
Home Financials for this Owner
Home Financials are based on the most recent Mortgage that was taken out on this home.
Original Mortgage
$353,500
Outstanding Balance
$338,317
Interest Rate
5.81%
Mortgage Type
New Conventional
Estimated Equity
$194,739
Purchase Details
Closed on
Aug 17, 2017
Sold by
Nelson Richard Dee and Nelson Summer L
Bought by
Anderson Ashley M and Anderson Joseph L
Home Financials for this Owner
Home Financials are based on the most recent Mortgage that was taken out on this home.
Original Mortgage
$307,232
Interest Rate
3.75%
Mortgage Type
FHA
Purchase Details
Closed on
Jan 28, 2016
Sold by
Hud
Bought by
Nelson Richard Dee and Nelson Summer L
Purchase Details
Closed on
Apr 28, 2014
Sold by
Quincy Joshua and Quincy Megann
Bought by
Lovell Amanda
Home Financials for this Owner
Home Financials are based on the most recent Mortgage that was taken out on this home.
Original Mortgage
$9,139
Interest Rate
4.28%
Mortgage Type
Stand Alone Second
Purchase Details
Closed on
Apr 28, 2010
Sold by
Lindberg Chris P and Lindberg Cassie
Bought by
Quincy Joshua and Quincy Megann
Home Financials for this Owner
Home Financials are based on the most recent Mortgage that was taken out on this home.
Original Mortgage
$216,015
Interest Rate
5.5%
Mortgage Type
FHA
Purchase Details
Closed on
Nov 21, 2002
Sold by
Mark Higley Construction Lc
Bought by
Lindberg Chris P and Lindberg Cassie
Home Financials for this Owner
Home Financials are based on the most recent Mortgage that was taken out on this home.
Original Mortgage
$159,497
Interest Rate
5.89%
Mortgage Type
FHA
Purchase Details
Closed on
Apr 9, 2002
Sold by
M & D Developers Llc
Bought by
Mark Higley Construction Lc
Home Financials for this Owner
Home Financials are based on the most recent Mortgage that was taken out on this home.
Original Mortgage
$135,200
Interest Rate
6.78%
Create a Home Valuation Report for This Property
The Home Valuation Report is an in-depth analysis detailing your home's value as well as a comparison with similar homes in the area
Home Values in the Area
Average Home Value in this Area
Purchase History
| Date | Buyer | Sale Price | Title Company |
|---|---|---|---|
| Anderson Ashley M | -- | Hickman Land Title | |
| Anderson Ashley M | -- | Vanguard Title | |
| Nelson Richard Dee | -- | Security Title | |
| Lovell Amanda | -- | Gateway Title Ins Agenc | |
| Quincy Joshua | -- | First American Title | |
| Lindberg Chris P | -- | Heritage West Title Insuranc | |
| Mark Higley Construction Lc | -- | Heritage West Title Insuranc |
Source: Public Records
Mortgage History
| Date | Status | Borrower | Loan Amount |
|---|---|---|---|
| Open | Anderson Ashley M | $353,500 | |
| Previous Owner | Anderson Ashley M | $307,232 | |
| Previous Owner | Lovell Amanda | $9,139 | |
| Previous Owner | Quincy Joshua | $216,015 | |
| Previous Owner | Lindberg Chris P | $159,497 | |
| Previous Owner | Mark Higley Construction Lc | $135,200 |
Source: Public Records
Tax History
| Year | Tax Paid | Tax Assessment Tax Assessment Total Assessment is a certain percentage of the fair market value that is determined by local assessors to be the total taxable value of land and additions on the property. | Land | Improvement |
|---|---|---|---|---|
| 2025 | $3,136 | $281,050 | $92,811 | $188,239 |
| 2024 | $3,034 | $273,900 | $88,597 | $185,303 |
| 2023 | $2,795 | $463,000 | $139,939 | $323,061 |
| 2022 | $3,063 | $274,450 | $78,395 | $196,055 |
| 2021 | $2,881 | $390,000 | $92,965 | $297,035 |
| 2020 | $2,506 | $337,000 | $80,085 | $256,915 |
| 2019 | $2,426 | $322,000 | $77,116 | $244,884 |
| 2018 | $2,266 | $293,000 | $68,449 | $224,551 |
| 2016 | $2,004 | $135,520 | $27,983 | $107,537 |
| 2015 | $1,953 | $125,895 | $27,983 | $97,912 |
| 2014 | $1,861 | $121,570 | $27,983 | $93,587 |
| 2013 | -- | $94,455 | $30,690 | $63,765 |
Source: Public Records
Map
Nearby Homes
- 195 E 2325 S
- 2345 S Main St
- 1250 N 2925 W
- 2480 S Main St
- 3250 W 1075 N
- 3389 W Gordon Ave
- 1969 S 575 E
- 369 W 1900 S
- 460 E 1700 S Unit 1 & 2
- 1186 N 2425 W
- 1877 S 725 E
- 816 N 2700 W
- 1685 S 245 W
- 1141 N 2275 W
- 906 E Sam Cir
- 1876 W 1575 N Unit 237
- 1570 N 1875 W Unit 242
- 1570 N 1875 W
- 1558 N 1875 W
- 1558 N 1875 W Unit 245
Your Personal Tour Guide
Ask me questions while you tour the home.