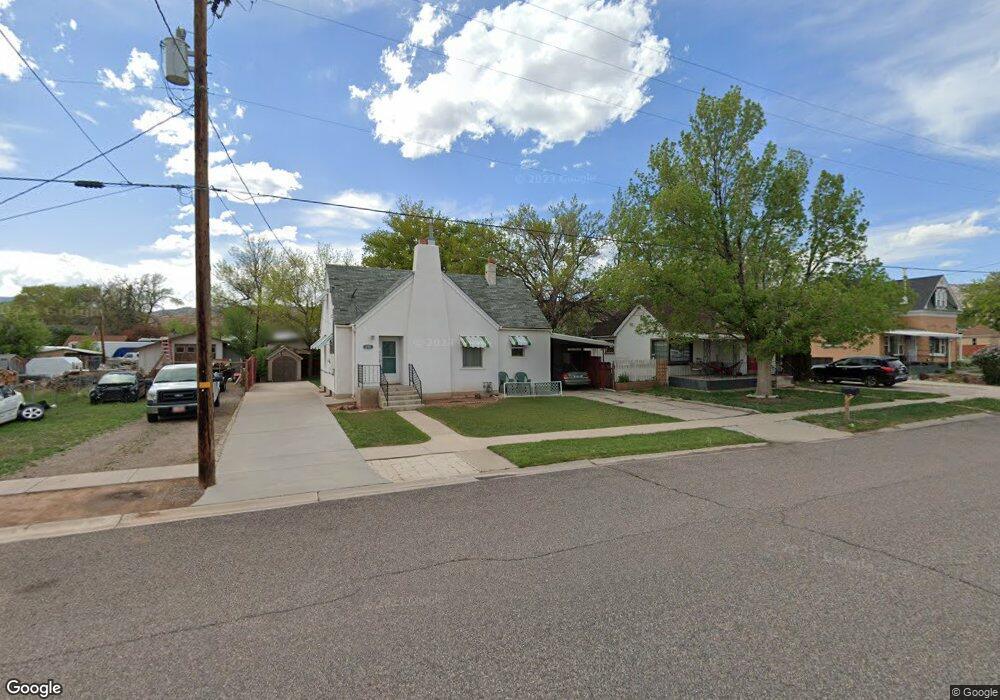
159 N 100 W Richfield, UT 84701
Estimated Value: $192,326 - $282,000
Studio
--
Bath
896
Sq Ft
$265/Sq Ft
Est. Value
About This Home
This home is located at 159 N 100 W, Richfield, UT 84701 and is currently estimated at $237,332, approximately $264 per square foot. 159 N 100 W is a home located in Sevier County with nearby schools including Ashman School, Pahvant School, and Red Hills Middle School.
Ownership History
Date
Name
Owned For
Owner Type
Purchase Details
Closed on
Feb 26, 2026
Sold by
Vee Mickelsen and Karst-Wheadon Family Irrevocable Trust
Bought by
Slate Stone Llc
Current Estimated Value
Home Financials for this Owner
Home Financials are based on the most recent Mortgage that was taken out on this home.
Original Mortgage
$161,827
Outstanding Balance
$161,668
Interest Rate
6.06%
Mortgage Type
New Conventional
Estimated Equity
$75,664
Purchase Details
Closed on
Apr 20, 2011
Sold by
Karst Maureen M
Bought by
Mickelsen Glenna Vee
Purchase Details
Closed on
Jul 27, 2010
Sold by
Moss Joseph L and Moss Sharlot B
Bought by
Talbot Alton R and Talbot Helene C
Home Financials for this Owner
Home Financials are based on the most recent Mortgage that was taken out on this home.
Original Mortgage
$14,850
Interest Rate
4.71%
Mortgage Type
Credit Line Revolving
Create a Home Valuation Report for This Property
The Home Valuation Report is an in-depth analysis detailing your home's value as well as a comparison with similar homes in the area
Purchase History
| Date | Buyer | Sale Price | Title Company |
|---|---|---|---|
| Slate Stone Llc | -- | First American Title | |
| Mickelsen Glenna Vee | -- | -- | |
| Talbot Alton R | -- | -- |
Source: Public Records
Mortgage History
| Date | Status | Borrower | Loan Amount |
|---|---|---|---|
| Open | Slate Stone Llc | $161,827 | |
| Previous Owner | Talbot Alton R | $14,850 | |
| Previous Owner | Talbot Alton R | $79,200 |
Source: Public Records
Tax History
| Year | Tax Paid | Tax Assessment Tax Assessment Total Assessment is a certain percentage of the fair market value that is determined by local assessors to be the total taxable value of land and additions on the property. | Land | Improvement |
|---|---|---|---|---|
| 2025 | $1,019 | $104,980 | $36,188 | $68,792 |
| 2024 | $1,019 | $108,167 | $30,065 | $78,102 |
| 2023 | $1,070 | $118,931 | $27,935 | $90,996 |
| 2022 | $1,062 | $96,999 | $22,919 | $74,080 |
| 2021 | $970 | $74,567 | $24,339 | $50,228 |
| 2020 | $1,519 | $113,477 | $32,076 | $81,401 |
| 2019 | $706 | $55,840 | $14,700 | $41,140 |
| 2018 | $0 | $50,040 | $14,700 | $35,340 |
| 2017 | $686 | $46,420 | $14,700 | $31,720 |
| 2016 | -- | $46,420 | $0 | $0 |
| 2015 | -- | $42,950 | $0 | $0 |
| 2014 | -- | $40,900 | $0 | $0 |
Source: Public Records
Map
Nearby Homes
Your Personal Tour Guide
Ask me questions while you tour the home.