159 Sylvan Rd Lancaster, MA 01523
Lancaster AreaEstimated Value: $396,000 - $513,000
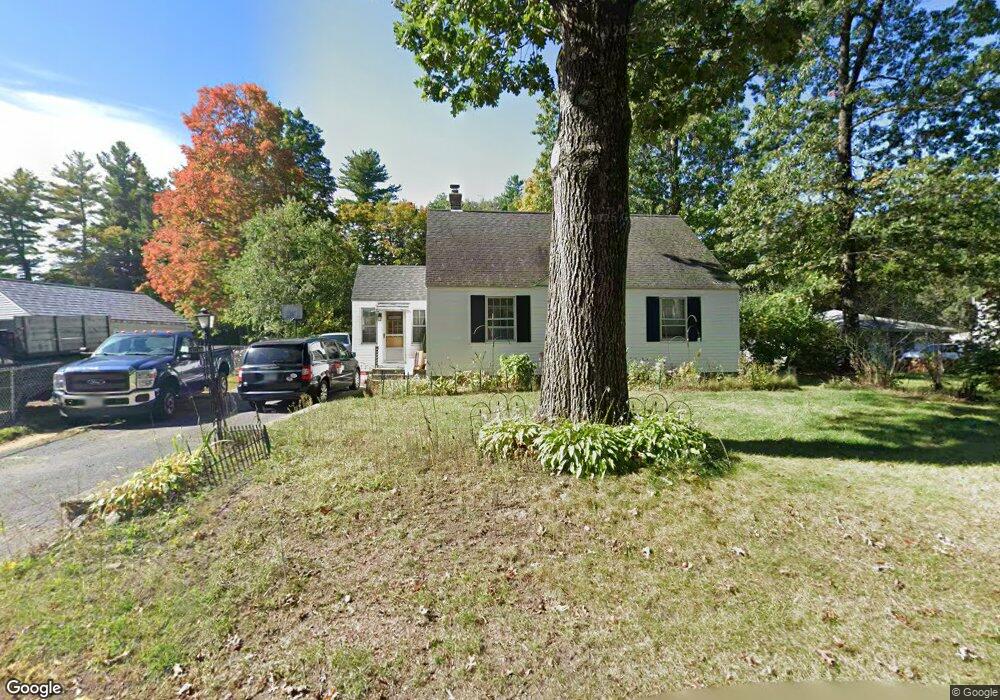
About This Home
This home is located at 159 Sylvan Rd, Lancaster, MA 01523 and is currently estimated at $445,264, approximately $328 per square foot. 159 Sylvan Rd is a home located in Worcester County with nearby schools including Mary Rowlandson Elementary School, Luther Burbank Middle School, and Nashoba Regional High School.
Ownership History
We collect this data history from publicly available records. To have your information removed, we recommend requesting removal directly through your county’s website.
Purchase Details
Home Values in the Area
Average Home Value in this Area
Purchase History
We collect this data history from publicly available records. To have your information removed, we recommend requesting removal directly through your county’s website.
| Date | Buyer | Sale Price | Title Company |
|---|---|---|---|
| $198,500 | -- |
Mortgage History
We collect this data history from publicly available records. To have your information removed, we recommend requesting removal directly through your county’s website.
| Date | Status | Borrower | Loan Amount |
|---|---|---|---|
| Open | $183,900 | ||
| Closed | $190,398 |
Tax History
We collect this data history from publicly available records. To have your information removed, we recommend requesting removal directly through your county’s website.
| Year | Tax Paid | Tax Assessment Tax Assessment Total Assessment is a certain percentage of the fair market value that is determined by local assessors to be the total taxable value of land and additions on the property. | Land | Improvement |
|---|---|---|---|---|
| 2025 | $4,631 | $286,600 | $99,500 | $187,100 |
| 2024 | $4,643 | $265,900 | $92,600 | $173,300 |
| 2023 | $4,373 | $254,400 | $84,200 | $170,200 |
| 2022 | $4,147 | $213,200 | $87,600 | $125,600 |
| 2021 | $4,074 | $203,900 | $87,600 | $116,300 |
| 2020 | $3,994 | $201,200 | $87,600 | $113,600 |
| 2019 | $3,828 | $193,800 | $87,600 | $106,200 |
| 2018 | $3,716 | $186,000 | $87,600 | $98,400 |
| 2016 | $3,462 | $177,100 | $86,800 | $90,300 |
| 2015 | $3,309 | $176,400 | $86,800 | $89,600 |
| 2014 | $3,232 | $170,900 | $86,800 | $84,100 |
Map
- 149 Sterling Rd
- 19 Sylvan Rd
- 141 Sylvan Rd
- 154 Sylvan Rd
- 157 Sterling Rd
- 146 Sylvan Rd
- 7 Sylvan Rd
- 31 Sylvan Rd
- 175 Sterling Rd
- 129 Sterling Rd
- 129 Sterling Rd Unit 1
- 131 Sylvan Rd
- 134 Sylvan Rd
- 66 Sylvan Rd
- 66 Sylvan Rd Unit 1
- 43 Sylvan Rd
- 121 Sterling Rd
- 148 Sterling Rd
- 113 Sterling Rd
- 80 Sylvan Rd
Ask me questions while you tour the home.