16 Appleton St Waltham, MA 02453
Bleachery NeighborhoodEstimated Value: $971,228 - $1,188,000
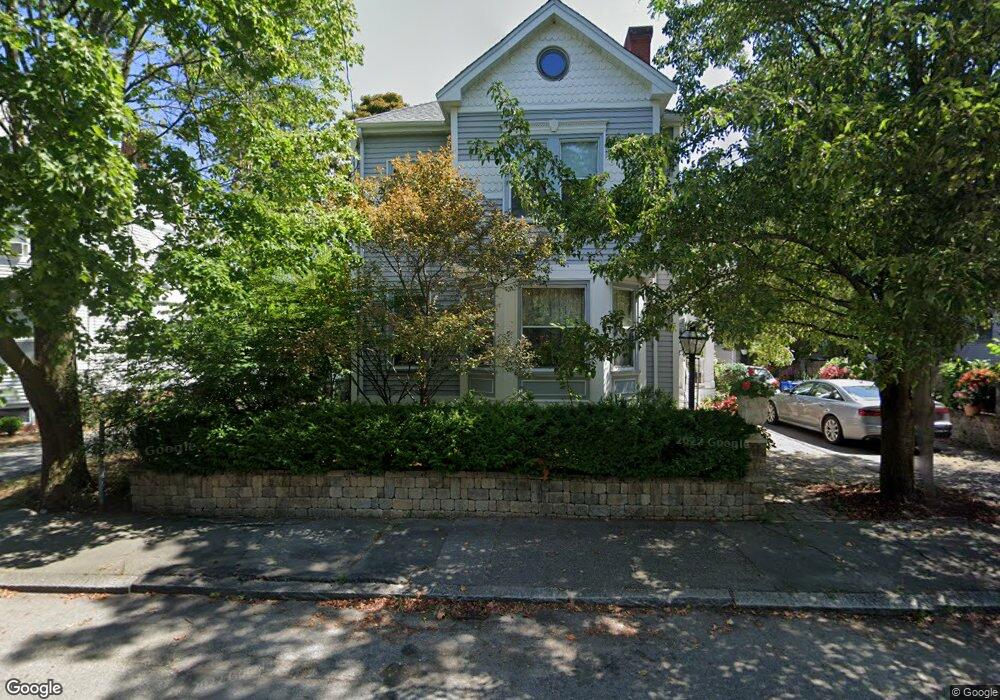
About This Home
This home is located at 16 Appleton St, Waltham, MA 02453 and is currently estimated at $1,069,057, approximately $468 per square foot. 16 Appleton St is a home located in Middlesex County with nearby schools including James Fitzgerald Elementary School, John W. Mcdevitt Middle School, and Waltham Sr High School.
Ownership History
We collect this data history from publicly available records. To have your information removed, we recommend requesting removal directly through your county’s website.
Purchase Details
Home Values in the Area
Average Home Value in this Area
Purchase History
We collect this data history from publicly available records. To have your information removed, we recommend requesting removal directly through your county’s website.
| Date | Buyer | Sale Price | Title Company |
|---|---|---|---|
| $37,000 | -- |
Mortgage History
We collect this data history from publicly available records. To have your information removed, we recommend requesting removal directly through your county’s website.
| Date | Status | Borrower | Loan Amount |
|---|---|---|---|
| Open | $47,000 | ||
| Open | $109,488 | ||
| Open | $225,000 |
Tax History
We collect this data history from publicly available records. To have your information removed, we recommend requesting removal directly through your county’s website.
| Year | Tax Paid | Tax Assessment Tax Assessment Total Assessment is a certain percentage of the fair market value that is determined by local assessors to be the total taxable value of land and additions on the property. | Land | Improvement |
|---|---|---|---|---|
| 2025 | $7,835 | $797,900 | $326,700 | $471,200 |
| 2024 | $7,618 | $790,200 | $324,600 | $465,600 |
| 2023 | $6,969 | $675,300 | $311,100 | $364,200 |
| 2022 | $7,033 | $631,300 | $284,100 | $347,200 |
| 2021 | $6,094 | $538,300 | $229,900 | $308,400 |
| 2020 | $5,830 | $487,900 | $202,900 | $285,000 |
| 2019 | $5,546 | $438,100 | $200,900 | $237,200 |
| 2018 | $5,034 | $399,200 | $186,000 | $213,200 |
| 2017 | $4,802 | $382,300 | $169,100 | $213,200 |
| 2016 | $4,679 | $382,300 | $169,100 | $213,200 |
| 2015 | $4,576 | $348,500 | $152,200 | $196,300 |
Map
- 26 Cross St
- 11 Mount Pleasant St Unit 1
- 7 Gibbs Ct
- 70 School St
- 128 Church St Unit 2
- 200 Church St Unit 200-202
- 28-32 Calvary St
- 61 Gale St Unit 1
- 227-229 Newton St
- 43 Hall St Unit 1
- 172 Bright St Unit 3
- 94 Cushing St Unit 3
- 29 Spruce St Unit 23
- 6 Cushing St Unit 1
- 103 Cushing St Unit 4
- 61 Hall St Unit PH 18
- 220 Grove St Unit 1
- 30 Russell St Unit 5
- 165 River St Unit 2
- 74 Harvard St
- 12 Appleton St
- 22 Appleton St
- 22 Appleton St Unit 2
- 22 Appleton St Unit 1
- 19 Appleton St
- 11 Appleton St
- 520 Main St Unit 201A
- 520 Main St Unit 201B
- 520 Main St Unit 200
- 520 Main St
- 520 Main St Unit 17
- 520 Main St Unit 3
- 520 Main St Unit 6
- 520 Main St Unit c
- 520 Main St Unit 9
- 520 Main St Unit 11
- 520 Main St Unit 16
- 520 Main St Unit 15
- 520 Main St Unit 18
- 520 Main St Unit 12
Ask me questions while you tour the home.