J
Landlord's Agent in 2017
John Federico
Greater Metropolitan R. E.

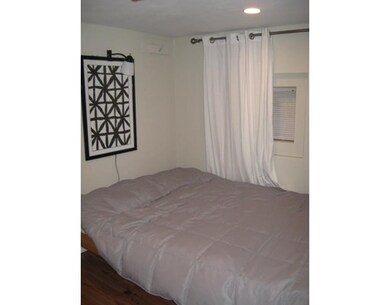
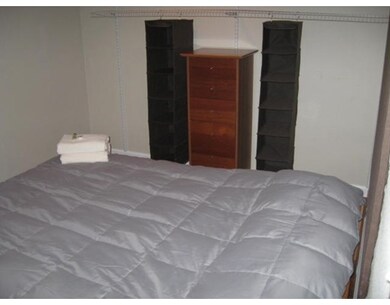
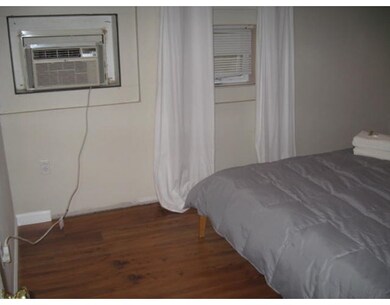
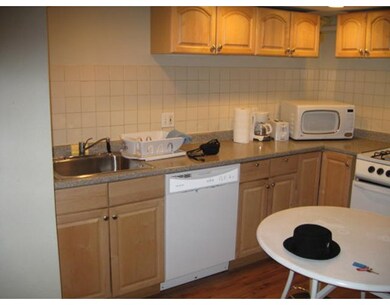
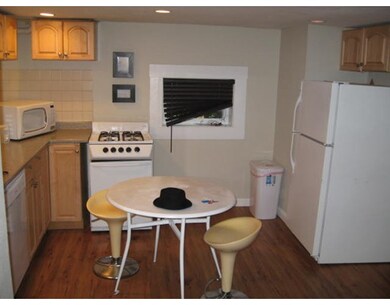
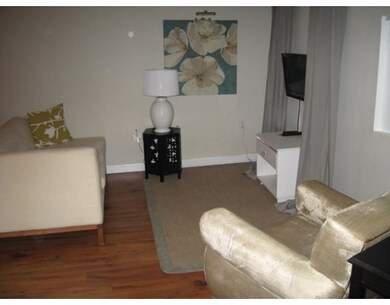
Available Immediately. Ready to Move ~ Lets make a deal! Ground/Basement level 2 bed - 2 Good Sized Bedrooms. Kitchen/living room combination . Kitchen has dishwasher. Full Bathroom with standup shower. Laundry around the corner Walk to Laundromat at the top of the street ~ Close to restaurants shops and walk to T~
Last Agent to Rent the Property
John Federico
Greater Metropolitan R. E. Listed on: 11/14/2016
Last Renter's Agent
John Federico
Greater Metropolitan R. E. Listed on: 11/14/2016
Home Type
Other
Lot Details
2,295.68 Acres
| Date | Event | Price | List to Sale | Price per Sq Ft |
|---|---|---|---|---|
| 01/09/2017 01/09/17 | Rented | $2,000 | 0.0% | -- |
| 12/06/2016 12/06/16 | Price Changed | $2,000 | -20.0% | $0 / Sq Ft |
| 11/14/2016 11/14/16 | For Rent | $2,500 | -- | -- |
| Year | Tax Paid | Tax Assessment Tax Assessment Total Assessment is a certain percentage of the fair market value that is determined by local assessors to be the total taxable value of land and additions on the property. | Land | Improvement |
|---|---|---|---|---|
| 2025 | $47,591 | $4,109,800 | $1,628,100 | $2,481,700 |
| 2024 | $45,535 | $4,177,500 | $1,628,100 | $2,549,400 |
| 2023 | $45,641 | $4,249,600 | $1,628,100 | $2,621,500 |
| 2022 | $45,451 | $4,177,500 | $1,628,100 | $2,549,400 |
| 2021 | $44,574 | $4,177,500 | $1,502,700 | $2,674,800 |
| 2020 | $42,354 | $4,010,800 | $1,502,700 | $2,508,100 |
| 2019 | $41,580 | $3,945,000 | $1,502,700 | $2,442,300 |
| 2018 | $39,782 | $3,796,000 | $1,444,000 | $2,352,000 |
| 2017 | $38,595 | $3,644,500 | $1,374,600 | $2,269,900 |
| 2016 | $38,280 | $3,480,000 | $1,273,100 | $2,206,900 |
| 2015 | $38,637 | $3,190,500 | $1,137,000 | $2,053,500 |
| 2014 | $30,022 | $2,386,500 | $987,500 | $1,399,000 |
J
Landlord's Agent in 2017
John Federico
Greater Metropolitan R. E.
Source: MLS Property Information Network (MLS PIN)
MLS Number: 72093238
APN: CBOS W:03 P:03088 S:000
Disclaimer: Certain information contained herein is derived from information provided by parties other than Homes.com. All information provided is deemed reliable, but is not guaranteed to be accurate and should be independently verified.
![]() The property listing data and information, or the Images, set forth herein were provided to MLS Property Information Network, Inc. from third party sources, including sellers, lessors and public records, and were compiled by MLS Property Information Network, Inc. The property listing data and information, and the Images, are for the personal, non-commercial use of consumers having a good faith interest in purchasing or leasing listed properties of the type displayed to them and may not be used for any purpose other than to identify prospective properties which such consumers may have a good faith interest in purchasing or leasing. MLS Property Information Network, Inc. and its subscribers disclaim any and all representations and warranties as to the accuracy of the property listing data and information, or as to the accuracy of any of the Images, set forth herein.
The property listing data and information, or the Images, set forth herein were provided to MLS Property Information Network, Inc. from third party sources, including sellers, lessors and public records, and were compiled by MLS Property Information Network, Inc. The property listing data and information, and the Images, are for the personal, non-commercial use of consumers having a good faith interest in purchasing or leasing listed properties of the type displayed to them and may not be used for any purpose other than to identify prospective properties which such consumers may have a good faith interest in purchasing or leasing. MLS Property Information Network, Inc. and its subscribers disclaim any and all representations and warranties as to the accuracy of the property listing data and information, or as to the accuracy of any of the Images, set forth herein.
Ask me questions while you tour the home.
