16 Beach Rd Gloucester, MA 01930
Estimated Value: $1,252,000 - $1,466,000
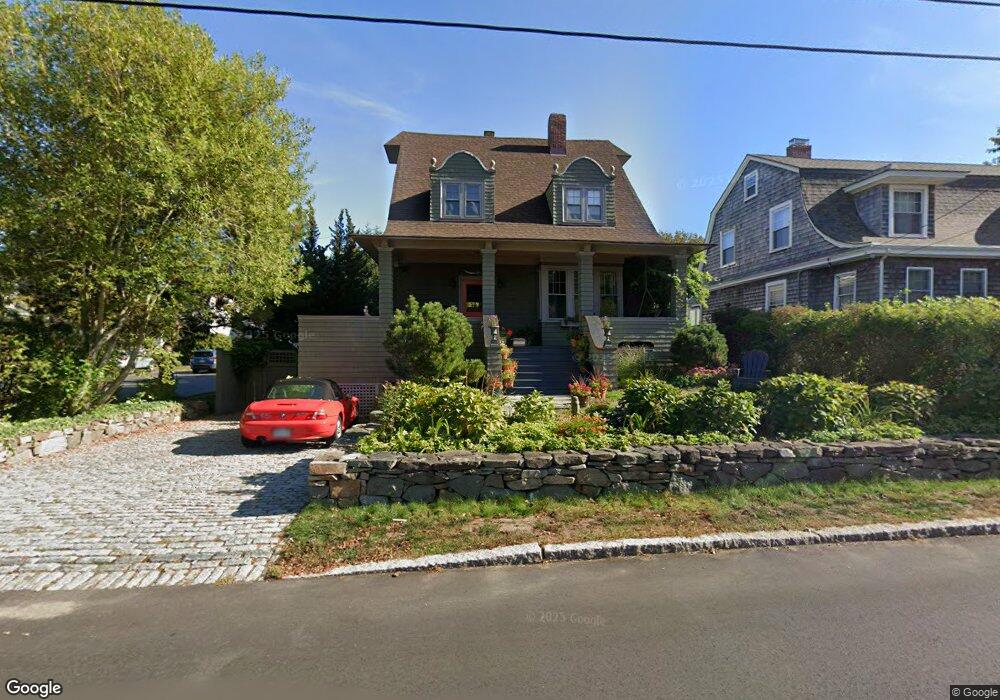
About This Home
This home is located at 16 Beach Rd, Gloucester, MA 01930 and is currently estimated at $1,361,720, approximately $535 per square foot. 16 Beach Rd is a home located in Essex County with nearby schools including Rockport Elementary School, Rockport Middle School, and Rockport High School.
Ownership History
We collect this data history from publicly available records. To have your information removed, we recommend requesting removal directly through your county’s website.
Purchase Details
Home Financials for this Owner
Home Financials are based on the most recent Mortgage that was taken out on this home.Purchase Details
Purchase Details
Purchase Details
Purchase Details
Home Values in the Area
Average Home Value in this Area
Purchase History
We collect this data history from publicly available records. To have your information removed, we recommend requesting removal directly through your county’s website.
| Date | Buyer | Sale Price | Title Company |
|---|---|---|---|
| $550,000 | -- | ||
| $450,000 | -- | ||
| $258,000 | -- | ||
| $185,000 | -- | ||
| $244,000 | -- |
Mortgage History
We collect this data history from publicly available records. To have your information removed, we recommend requesting removal directly through your county’s website.
| Date | Status | Borrower | Loan Amount |
|---|---|---|---|
| Open | $292,000 | ||
| Closed | $412,500 |
Tax History
We collect this data history from publicly available records. To have your information removed, we recommend requesting removal directly through your county’s website.
| Year | Tax Paid | Tax Assessment Tax Assessment Total Assessment is a certain percentage of the fair market value that is determined by local assessors to be the total taxable value of land and additions on the property. | Land | Improvement |
|---|---|---|---|---|
| 2025 | $11,653 | $1,198,900 | $488,100 | $710,800 |
| 2024 | $10,504 | $1,079,500 | $368,700 | $710,800 |
| 2023 | $9,418 | $889,300 | $273,600 | $615,700 |
| 2022 | $9,114 | $777,000 | $237,900 | $539,100 |
| 2021 | $8,794 | $706,900 | $216,300 | $490,600 |
| 2020 | $8,774 | $711,600 | $216,300 | $495,300 |
| 2019 | $8,496 | $669,500 | $206,200 | $463,300 |
| 2018 | $8,158 | $630,900 | $201,200 | $429,700 |
| 2017 | $7,899 | $598,900 | $191,600 | $407,300 |
| 2016 | $7,513 | $552,000 | $183,300 | $368,700 |
| 2015 | $7,088 | $519,300 | $179,100 | $340,200 |
Map
- 9 Oxford Rd
- 18r Starknaught Heights Unit A
- 25 Salt Island Rd
- 32 Witham St Unit B
- 33 Highview Rd
- 8 Atlantic Rd
- 176 Main St Unit B
- 176 Main St Unit A
- 27 Hodgkins Rd
- 4 Graystone Rd
- 2 Harrison Ave
- 38R Bass Ave
- 68 Eden Rd
- 1B Greystone Ln Unit 1B
- 18 Traverse St
- 5 Mount Pleasant Ave
- 42 E Main St
- 4 Toomey Ln
- 48 Eden Rd
- 59 High St Unit 2
Ask me questions while you tour the home.