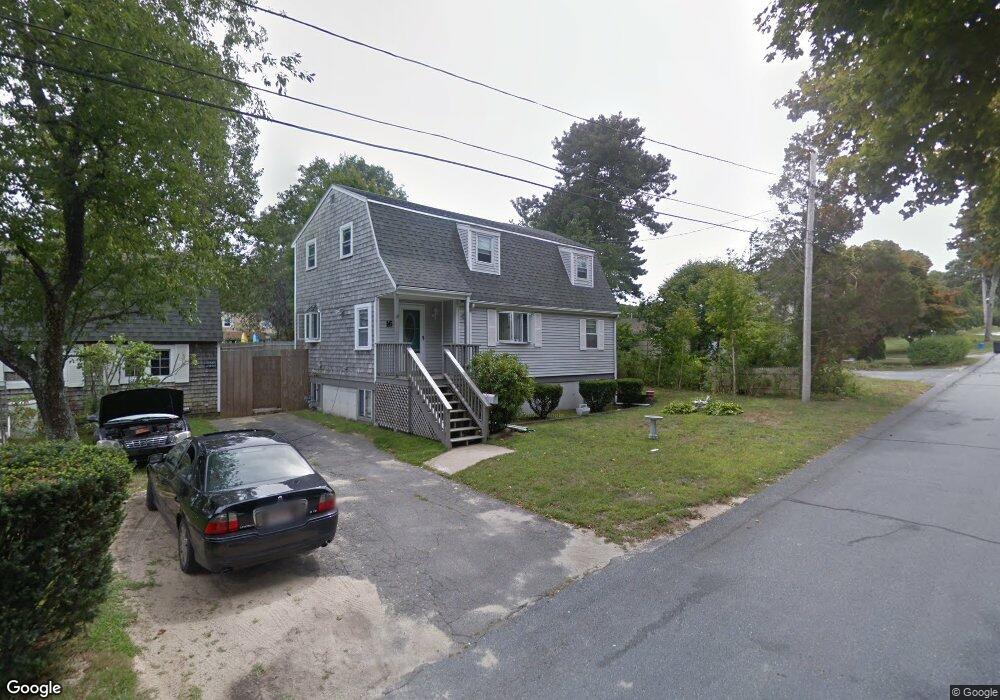
16 Blueberry Rd Bourne, MA 2532
Buzzards Bay NeighborhoodEstimated Value: $532,000 - $653,445
3
Beds
1
Bath
2,120
Sq Ft
$269/Sq Ft
Est. Value
About This Home
This home is located at 16 Blueberry Rd, Bourne, MA 2532 and is currently estimated at $569,861, approximately $268 per square foot. 16 Blueberry Rd is a home located in Barnstable County with nearby schools including Bourne High School and St Margaret Regional School.
Ownership History
Date
Name
Owned For
Owner Type
Purchase Details
Closed on
Mar 12, 2025
Sold by
Strati Robert A and Strati David P
Bought by
Krohn David T
Current Estimated Value
Purchase Details
Closed on
Aug 9, 2023
Sold by
Chapman Dorothy and Chapman Ronald A
Bought by
T & O Re Dev Group Llc
Home Financials for this Owner
Home Financials are based on the most recent Mortgage that was taken out on this home.
Original Mortgage
$379,000
Interest Rate
6.71%
Mortgage Type
Purchase Money Mortgage
Create a Home Valuation Report for This Property
The Home Valuation Report is an in-depth analysis detailing your home's value as well as a comparison with similar homes in the area
Home Values in the Area
Average Home Value in this Area
Purchase History
We collect this data history from publicly available records. To have your information removed, we recommend requesting removal directly through your county’s website.
| Date | Buyer | Sale Price | Title Company |
|---|---|---|---|
| Krohn David T | $50,000 | None Available | |
| Krohn David T | $50,000 | None Available | |
| T & O Re Dev Group Llc | $470,000 | None Available |
Source: Public Records
Mortgage History
We collect this data history from publicly available records. To have your information removed, we recommend requesting removal directly through your county’s website.
| Date | Status | Borrower | Loan Amount |
|---|---|---|---|
| Previous Owner | T & O Re Dev Group Llc | $379,000 |
Source: Public Records
Tax History
| Year | Tax Paid | Tax Assessment Tax Assessment Total Assessment is a certain percentage of the fair market value that is determined by local assessors to be the total taxable value of land and additions on the property. | Land | Improvement |
|---|---|---|---|---|
| 2025 | $3,772 | $483,000 | $184,800 | $298,200 |
| 2024 | $3,607 | $449,700 | $176,000 | $273,700 |
| 2023 | $3,513 | $398,700 | $155,800 | $242,900 |
| 2022 | $3,388 | $335,800 | $137,800 | $198,000 |
| 2021 | $3,301 | $306,500 | $125,400 | $181,100 |
| 2020 | $3,208 | $298,700 | $124,200 | $174,500 |
| 2019 | $3,043 | $289,500 | $124,200 | $165,300 |
| 2018 | $2,911 | $276,200 | $118,400 | $157,800 |
| 2017 | $2,698 | $261,900 | $117,200 | $144,700 |
| 2016 | $2,597 | $255,600 | $117,200 | $138,400 |
| 2015 | $2,574 | $255,600 | $117,200 | $138,400 |
Source: Public Records
Map
Nearby Homes
- 9 Blueberry Rd
- 33 Head of The Bay Rd
- 14 Quamhassett Rd
- 9 Fabyan Way
- 13 Harrison Ave
- 46 Holt Rd Unit A
- 65 Lewis Point Rd
- 0 Holt Rd
- 32 Everett Rd
- 151 - 153 Main St
- 38 Old Bridge Rd
- 6 Honora Ln
- 5 Honora Ln Unit 5
- 5 Honora Ln
- 3 Honora Ln Unit 3
- 34 Washington Ave
- 4 Van Bummel Rd
- 50 Maynard Ln Unit 50
- 56 Rip Van Winkle Way
- 25 Nautical Way Unit E
Your Personal Tour Guide
Ask me questions while you tour the home.