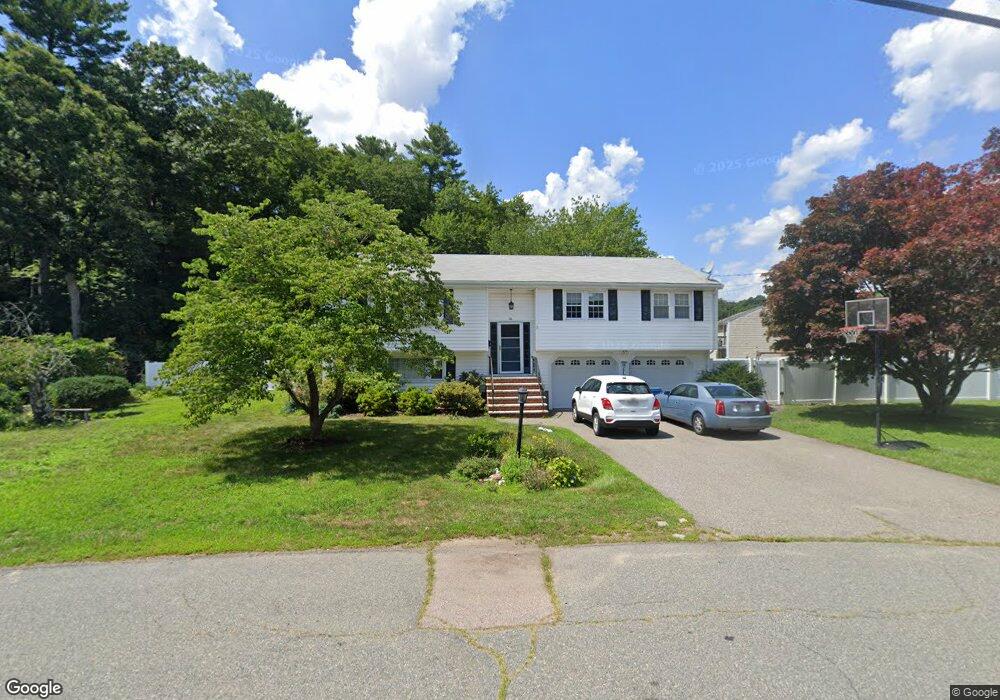
16 Casey St Canton, MA 02021
Estimated Value: $651,000 - $803,757
3
Beds
3
Baths
1,858
Sq Ft
$395/Sq Ft
Est. Value
About This Home
This home is located at 16 Casey St, Canton, MA 02021 and is currently estimated at $733,189, approximately $394 per square foot. 16 Casey St is a home located in Norfolk County with nearby schools including Canton High School and St. John the Evangelist School.
Ownership History
Date
Name
Owned For
Owner Type
Purchase Details
Closed on
Nov 25, 2025
Sold by
Maddestra Ft and Maddestra
Bought by
Kilcommons John and Kilcommons Melanie
Current Estimated Value
Home Financials for this Owner
Home Financials are based on the most recent Mortgage that was taken out on this home.
Original Mortgage
$280,000
Outstanding Balance
$280,000
Interest Rate
6.3%
Mortgage Type
New Conventional
Estimated Equity
$453,189
Purchase Details
Closed on
Apr 30, 2010
Sold by
Perry 3Rd William J and Perry Cynthia M
Bought by
Maddestra Robert and Maddestra Ilona
Purchase Details
Closed on
Jun 22, 2006
Sold by
Baldwin Charles J and Baldwin Helen K
Bought by
Perry Cynthia M and Perry William J
Home Financials for this Owner
Home Financials are based on the most recent Mortgage that was taken out on this home.
Original Mortgage
$330,000
Interest Rate
6.59%
Mortgage Type
Purchase Money Mortgage
Purchase Details
Closed on
Sep 6, 2001
Sold by
Sullivan Paul J and Sullivan Cecilia A
Bought by
Baldwin Charles J and Baldwin Helen K
Home Financials for this Owner
Home Financials are based on the most recent Mortgage that was taken out on this home.
Original Mortgage
$275,000
Interest Rate
7.05%
Mortgage Type
Purchase Money Mortgage
Create a Home Valuation Report for This Property
The Home Valuation Report is an in-depth analysis detailing your home's value as well as a comparison with similar homes in the area
Home Values in the Area
Average Home Value in this Area
Purchase History
| Date | Buyer | Sale Price | Title Company |
|---|---|---|---|
| Kilcommons John | $650,000 | -- | |
| Maddestra Robert | $430,000 | -- | |
| Perry Cynthia M | $475,000 | -- | |
| Baldwin Charles J | $359,900 | -- |
Source: Public Records
Mortgage History
| Date | Status | Borrower | Loan Amount |
|---|---|---|---|
| Open | Kilcommons John | $280,000 | |
| Previous Owner | Perry Cynthia M | $330,000 | |
| Previous Owner | Baldwin Charles J | $275,000 | |
| Previous Owner | Baldwin Charles J | $50,000 |
Source: Public Records
Tax History
| Year | Tax Paid | Tax Assessment Tax Assessment Total Assessment is a certain percentage of the fair market value that is determined by local assessors to be the total taxable value of land and additions on the property. | Land | Improvement |
|---|---|---|---|---|
| 2025 | $6,186 | $625,500 | $330,000 | $295,500 |
| 2024 | $6,287 | $630,600 | $346,200 | $284,400 |
| 2023 | $6,214 | $587,900 | $346,200 | $241,700 |
| 2022 | $5,983 | $527,100 | $329,700 | $197,400 |
| 2021 | $5,558 | $455,600 | $274,700 | $180,900 |
| 2020 | $5,340 | $436,600 | $261,700 | $174,900 |
| 2019 | $5,002 | $403,400 | $237,800 | $165,600 |
| 2018 | $4,848 | $390,300 | $228,700 | $161,600 |
| 2017 | $5,041 | $394,100 | $224,200 | $169,900 |
| 2016 | $4,946 | $386,700 | $218,700 | $168,000 |
| 2015 | $4,797 | $374,200 | $212,400 | $161,800 |
Source: Public Records
Map
Nearby Homes
- 630 Pleasant St
- 859 Pleasant St
- 4 Jeffrey Rd
- 23 Pine St Unit K
- 60 Coppersmith Way Unit 304
- 20 Audubon Way Unit 205
- 20 Audubon Way Unit 302
- 20 Audubon Way Unit 109
- 20 Audubon Way Unit 410
- 20 Audubon Way Unit 408
- 20 Audubon Way Unit 210
- 20 Audubon Way Unit 104
- 20 Audubon Way Unit 101
- 20 Audubon Way Unit 103
- 4 Forge Pond Unit D
- 24 Forge Pond Unit H
- 12 Danforth St
- 16 Danforth St
- 6 Audubon Way Unit 6
- 1 Centre St Unit 11
Your Personal Tour Guide
Ask me questions while you tour the home.