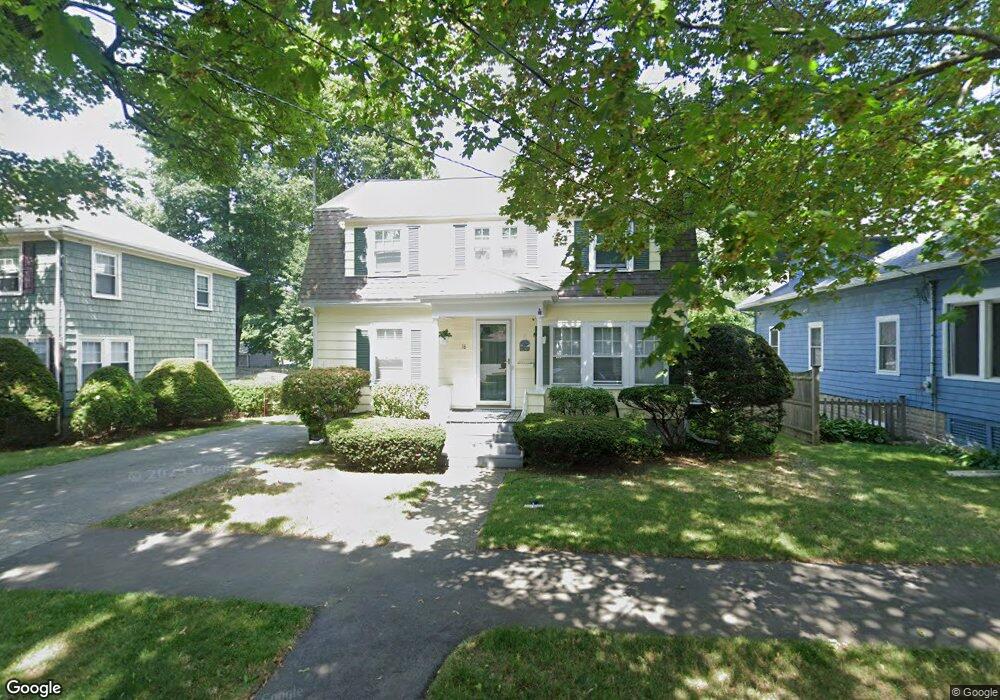
16 Chase St Danvers, MA 01923
Estimated Value: $668,000 - $857,000
About This Home
This home is located at 16 Chase St, Danvers, MA 01923 and is currently estimated at $803,541, approximately $426 per square foot. 16 Chase St is a home located in Essex County with nearby schools including Danvers High School, St. Mary of the Annunciation School, and St. John's Prep.
Ownership History
We collect this data history from publicly available records. To have your information removed, we recommend requesting removal directly through your county’s website.
Purchase Details
Home Financials for this Owner
Home Financials are based on the most recent Mortgage that was taken out on this home.Home Values in the Area
Average Home Value in this Area
Purchase History
We collect this data history from publicly available records. To have your information removed, we recommend requesting removal directly through your county’s website.
| Date | Buyer | Sale Price | Title Company |
|---|---|---|---|
| $175,000 | -- |
Mortgage History
We collect this data history from publicly available records. To have your information removed, we recommend requesting removal directly through your county’s website.
| Date | Status | Borrower | Loan Amount |
|---|---|---|---|
| Open | $140,000 | ||
| Closed | $157,500 |
Tax History
We collect this data history from publicly available records. To have your information removed, we recommend requesting removal directly through your county’s website.
| Year | Tax Paid | Tax Assessment Tax Assessment Total Assessment is a certain percentage of the fair market value that is determined by local assessors to be the total taxable value of land and additions on the property. | Land | Improvement |
|---|---|---|---|---|
| 2025 | $7,689 | $699,600 | $331,900 | $367,700 |
| 2024 | $7,549 | $679,500 | $320,500 | $359,000 |
| 2023 | $6,911 | $588,200 | $289,600 | $298,600 |
| 2022 | $6,849 | $541,000 | $263,200 | $277,800 |
| 2021 | $6,030 | $451,700 | $250,600 | $201,100 |
| 2020 | $5,622 | $430,500 | $250,600 | $179,900 |
| 2019 | $5,188 | $390,700 | $217,500 | $173,200 |
| 2018 | $5,073 | $374,700 | $217,500 | $157,200 |
| 2017 | $4,884 | $344,200 | $198,000 | $146,200 |
| 2016 | $4,699 | $330,900 | $188,800 | $142,100 |
| 2015 | $4,430 | $297,100 | $166,000 | $131,100 |
Map
- 4 Alden St Unit 3
- 10 Cottage Ave
- 8 Putnam St Unit 3
- 19 Edmunds Cove
- 17 Stafford Rd
- 12 Chestnut St
- 17 Charles St
- 14 Poplar St
- 18 Hardy St
- 106 Conant St
- 41 Hobart St Unit 2
- 41 Hobart St
- 180 Conant Conant St
- 22 Burley St
- 6 Jersey Ln
- 62 Purchase St Unit C3
- 4 Meadow Ln
- 95 Abington Rd Unit 95
- 16 Beaver Park
- 45 Abington Rd Unit 45
Ask me questions while you tour the home.