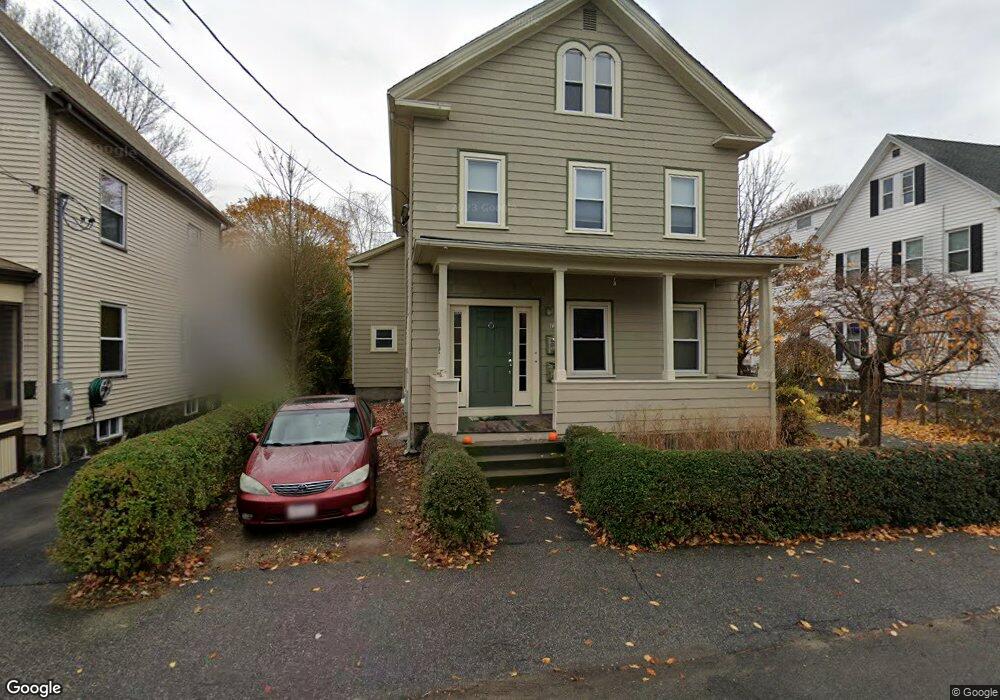
16 Franklin St Wakefield, MA 01880
East Side NeighborhoodEstimated Value: $845,000 - $1,003,000
4
Beds
3
Baths
2,220
Sq Ft
$416/Sq Ft
Est. Value
About This Home
This home is located at 16 Franklin St, Wakefield, MA 01880 and is currently estimated at $922,417, approximately $415 per square foot. 16 Franklin St is a home located in Middlesex County with nearby schools including Wakefield Memorial High School and St Joseph School.
Ownership History
Date
Name
Owned For
Owner Type
Purchase Details
Closed on
Jun 29, 2004
Sold by
Abruzese Anthony and Freedman Miles
Bought by
Younker John J and Younker Linda G
Current Estimated Value
Purchase Details
Closed on
Aug 30, 1995
Sold by
Steen Edward R
Bought by
Freedman Miles and Tyrrell Kevin S
Purchase Details
Closed on
May 4, 1987
Sold by
Steen Edward Robt
Bought by
Steen Edward Robert
Create a Home Valuation Report for This Property
The Home Valuation Report is an in-depth analysis detailing your home's value as well as a comparison with similar homes in the area
Home Values in the Area
Average Home Value in this Area
Purchase History
We collect this data history from publicly available records. To have your information removed, we recommend requesting removal directly through your county’s website.
| Date | Buyer | Sale Price | Title Company |
|---|---|---|---|
| Younker John J | $532,000 | -- | |
| Freedman Miles | $176,000 | -- | |
| Freedman Miles | $176,000 | -- | |
| Steen Edward Robert | $45,500 | -- |
Source: Public Records
Mortgage History
We collect this data history from publicly available records. To have your information removed, we recommend requesting removal directly through your county’s website.
| Date | Status | Borrower | Loan Amount |
|---|---|---|---|
| Open | Steen Edward Robert | $326,000 | |
| Closed | Steen Edward Robert | $330,000 |
Source: Public Records
Tax History
| Year | Tax Paid | Tax Assessment Tax Assessment Total Assessment is a certain percentage of the fair market value that is determined by local assessors to be the total taxable value of land and additions on the property. | Land | Improvement |
|---|---|---|---|---|
| 2025 | $8,904 | $784,500 | $351,900 | $432,600 |
| 2024 | $8,775 | $780,000 | $349,900 | $430,100 |
| 2023 | $8,351 | $711,900 | $319,100 | $392,800 |
| 2022 | $7,996 | $649,000 | $290,600 | $358,400 |
| 2021 | $7,565 | $594,300 | $270,900 | $323,400 |
| 2020 | $7,094 | $555,500 | $253,200 | $302,300 |
| 2019 | $6,778 | $528,300 | $240,800 | $287,500 |
| 2018 | $6,311 | $487,300 | $222,100 | $265,200 |
| 2017 | $5,935 | $455,500 | $207,600 | $247,900 |
| 2016 | $5,536 | $410,400 | $196,400 | $214,000 |
| 2015 | $5,175 | $383,900 | $183,500 | $200,400 |
| 2014 | $4,720 | $369,300 | $176,400 | $192,900 |
Source: Public Records
Map
Nearby Homes
- 1 Traverse St Unit E
- 19 Wakefield Ave
- 11 Columbia Rd Unit 8
- 62 Foundry St Unit 312
- 62 Foundry St Unit 315
- 62 Foundry St Unit 505
- 62 Foundry St Unit 305
- 62 Foundry St Unit 202
- 4 Wakefield Ave Unit 4
- 9 Hart St
- 5 Ballister St Unit 523
- 175 North Ave Unit 407
- 7 Ballister St Unit 428
- 50 Albion St
- 8 Everett St
- 248 Albion St Unit 324
- 248 Albion St Unit 315
- 234 Water St Unit 205
- 4 Wiley Place
- 293 Albion St
- 14 Franklin St Unit 2
- 14 Franklin St Unit 3
- 14 Franklin St
- 20 Franklin St
- 15 Franklin St
- 17 Franklin St
- 12 Franklin St
- 12 Franklin St Unit 1
- 19 Franklin St Unit 1
- 11 Franklin St
- 5 Orchard St Unit 5
- 7 Orchard St Unit 7
- 57 Orchard St
- 10 Franklin St Unit 2
- 10 Franklin St Unit 1
- 10 Franklin St
- 9 Franklin St
- 9 Franklin St Unit 2
- 21 Franklin St
- 8 Franklin St
Your Personal Tour Guide
Ask me questions while you tour the home.