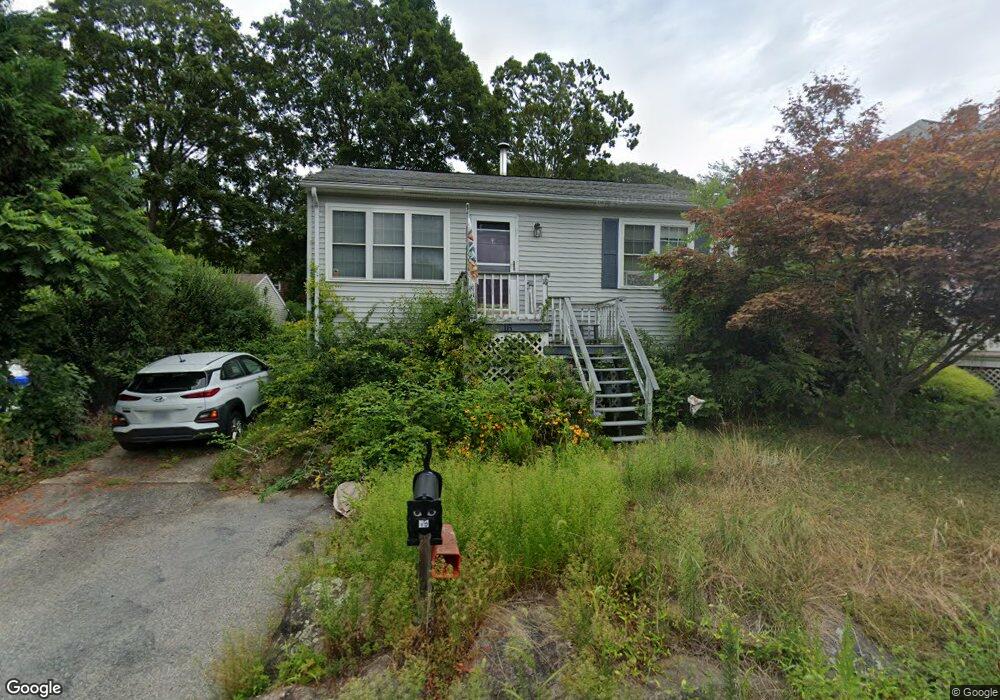
16 Knight St Coventry, RI 02816
West Warwick Centre NeighborhoodEstimated Value: $348,000 - $394,000
3
Beds
1
Bath
924
Sq Ft
$396/Sq Ft
Est. Value
About This Home
This home is located at 16 Knight St, Coventry, RI 02816 and is currently estimated at $365,577, approximately $395 per square foot. 16 Knight St is a home located in Kent County with nearby schools including Alan Shawn Feinstein Ms Of Cov, Coventry High School, and Father John V. Doyle School.
Ownership History
Date
Name
Owned For
Owner Type
Purchase Details
Closed on
Jun 26, 2013
Sold by
Fanning Kathleen S
Bought by
Fanning Michael S and Fanning Kathleen S
Current Estimated Value
Home Financials for this Owner
Home Financials are based on the most recent Mortgage that was taken out on this home.
Original Mortgage
$110,400
Interest Rate
3.51%
Create a Home Valuation Report for This Property
The Home Valuation Report is an in-depth analysis detailing your home's value as well as a comparison with similar homes in the area
Home Values in the Area
Average Home Value in this Area
Purchase History
We collect this data history from publicly available records. To have your information removed, we recommend requesting removal directly through your county’s website.
| Date | Buyer | Sale Price | Title Company |
|---|---|---|---|
| Fanning Michael S | -- | -- |
Source: Public Records
Mortgage History
We collect this data history from publicly available records. To have your information removed, we recommend requesting removal directly through your county’s website.
| Date | Status | Borrower | Loan Amount |
|---|---|---|---|
| Open | Fanning Michael S | $50,000 | |
| Closed | Fanning Michael S | $50,000 | |
| Closed | Fanning Michael S | $110,400 | |
| Previous Owner | Fanning Michael S | $120,000 |
Source: Public Records
Tax History
| Year | Tax Paid | Tax Assessment Tax Assessment Total Assessment is a certain percentage of the fair market value that is determined by local assessors to be the total taxable value of land and additions on the property. | Land | Improvement |
|---|---|---|---|---|
| 2025 | $3,820 | $237,400 | $75,900 | $161,500 |
| 2024 | $3,824 | $241,400 | $75,900 | $165,500 |
| 2023 | $3,701 | $241,400 | $75,900 | $165,500 |
| 2022 | $3,620 | $185,000 | $72,600 | $112,400 |
| 2021 | $3,589 | $185,000 | $72,600 | $112,400 |
| 2020 | $4,114 | $185,000 | $72,600 | $112,400 |
| 2019 | $3,031 | $136,300 | $35,600 | $100,700 |
| 2018 | $2,945 | $136,300 | $35,600 | $100,700 |
| 2017 | $2,860 | $136,300 | $35,600 | $100,700 |
| 2016 | $2,937 | $137,200 | $52,700 | $84,500 |
| 2015 | $2,858 | $137,200 | $52,700 | $84,500 |
| 2014 | $2,798 | $137,200 | $52,700 | $84,500 |
| 2013 | $2,549 | $136,600 | $41,600 | $95,000 |
Source: Public Records
Map
Nearby Homes
- 12 Hazard St
- 513 Washington St
- 505 Washington St
- 432 Fairview Ave
- 29 Anthony St
- 31 Anthony St Unit 33
- 376 Fairview Ave
- 6 Pilgrim Ave
- 15 Hope Ct
- 32 Pilgrim Ave
- 144 Blackrock Rd
- 325 Washington St Unit 1
- 70 East St
- 44 Capron St
- 10 Walnut St
- 9 Long Pond Rd
- 6 Middle St
- 9 Regent St Unit 11
- 7 Shippee Ave
- 75 Knotty Oak Rd
Your Personal Tour Guide
Ask me questions while you tour the home.