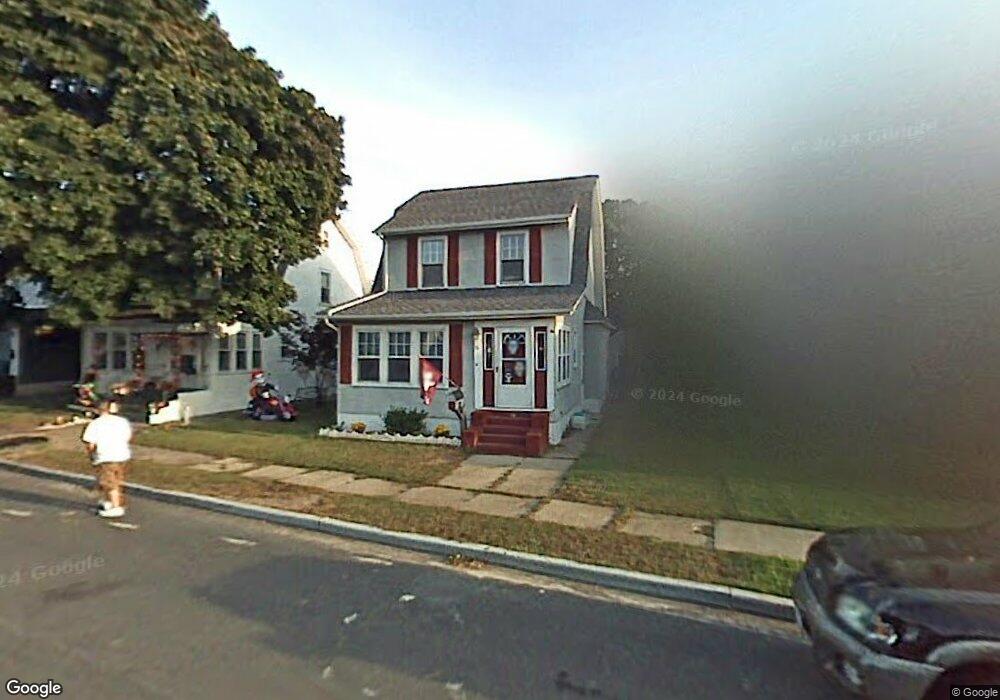
16 Maple Dr Lindenhurst, NY 11757
Estimated Value: $497,296 - $594,000
Studio
--
Bath
1,284
Sq Ft
$424/Sq Ft
Est. Value
About This Home
This home is located at 16 Maple Dr, Lindenhurst, NY 11757 and is currently estimated at $543,824, approximately $423 per square foot. 16 Maple Dr is a home located in Suffolk County with nearby schools including William Rall School, Lindenhurst Middle School, and Lindenhurst Senior High School.
Ownership History
Date
Name
Owned For
Owner Type
Purchase Details
Closed on
Jul 24, 2024
Sold by
Winey Jonathan S
Bought by
Lapolla Angela R
Current Estimated Value
Purchase Details
Closed on
Aug 9, 2012
Sold by
Winey Richard L
Bought by
Winey Jonathan S and Lapolla Angela R
Home Financials for this Owner
Home Financials are based on the most recent Mortgage that was taken out on this home.
Original Mortgage
$220,797
Interest Rate
2.89%
Mortgage Type
Purchase Money Mortgage
Purchase Details
Closed on
Aug 30, 2002
Sold by
Deruiter Michae and Deruiter Karen
Bought by
Winey Richard L
Home Financials for this Owner
Home Financials are based on the most recent Mortgage that was taken out on this home.
Original Mortgage
$180,000
Interest Rate
6.36%
Create a Home Valuation Report for This Property
The Home Valuation Report is an in-depth analysis detailing your home's value as well as a comparison with similar homes in the area
Home Values in the Area
Average Home Value in this Area
Purchase History
| Date | Buyer | Sale Price | Title Company |
|---|---|---|---|
| Lapolla Angela R | -- | None Available | |
| Lapolla Angela R | -- | None Available | |
| Winey Jonathan S | $225,000 | -- | |
| Winey Jonathan S | $225,000 | -- | |
| Winey Jonathan S | $225,000 | -- | |
| Winey Richard L | $240,000 | Titleworks Abstract Inc | |
| Winey Richard L | $240,000 | Titleworks Abstract Inc |
Source: Public Records
Mortgage History
| Date | Status | Borrower | Loan Amount |
|---|---|---|---|
| Previous Owner | Winey Jonathan S | $220,797 | |
| Previous Owner | Winey Richard L | $180,000 |
Source: Public Records
Tax History
| Year | Tax Paid | Tax Assessment Tax Assessment Total Assessment is a certain percentage of the fair market value that is determined by local assessors to be the total taxable value of land and additions on the property. | Land | Improvement |
|---|---|---|---|---|
| 2024 | $7,936 | $2,310 | $240 | $2,070 |
| 2023 | $7,936 | $2,310 | $240 | $2,070 |
| 2022 | $6,628 | $2,310 | $240 | $2,070 |
| 2021 | $6,628 | $2,310 | $240 | $2,070 |
| 2020 | $7,020 | $2,310 | $240 | $2,070 |
| 2019 | $7,020 | $0 | $0 | $0 |
| 2018 | $6,564 | $2,310 | $240 | $2,070 |
| 2017 | $6,564 | $2,310 | $240 | $2,070 |
| 2016 | $6,579 | $2,310 | $240 | $2,070 |
| 2015 | -- | $2,310 | $240 | $2,070 |
| 2014 | -- | $2,310 | $240 | $2,070 |
Source: Public Records
Map
Nearby Homes
- 43 E June St
- 303 Sherbrooke Rd
- 231 3rd St
- 90 Winchester Dr
- 47 Sherbrooke Rd
- 77 Farmers Ave
- 0 Tenety Ave Unit 3461459
- 350 52nd St
- 64 Heathcote Rd
- 48 Farmers Ave
- 449 52nd St
- 97 Berry St
- 449 51st St
- 334 Robbins St
- 456 48th St
- 342 9th St
- 436 Herzel Blvd
- 170 11th St
- 916 N Clinton Ave
- 0 Feustal St Unit KEY979504
Your Personal Tour Guide
Ask me questions while you tour the home.