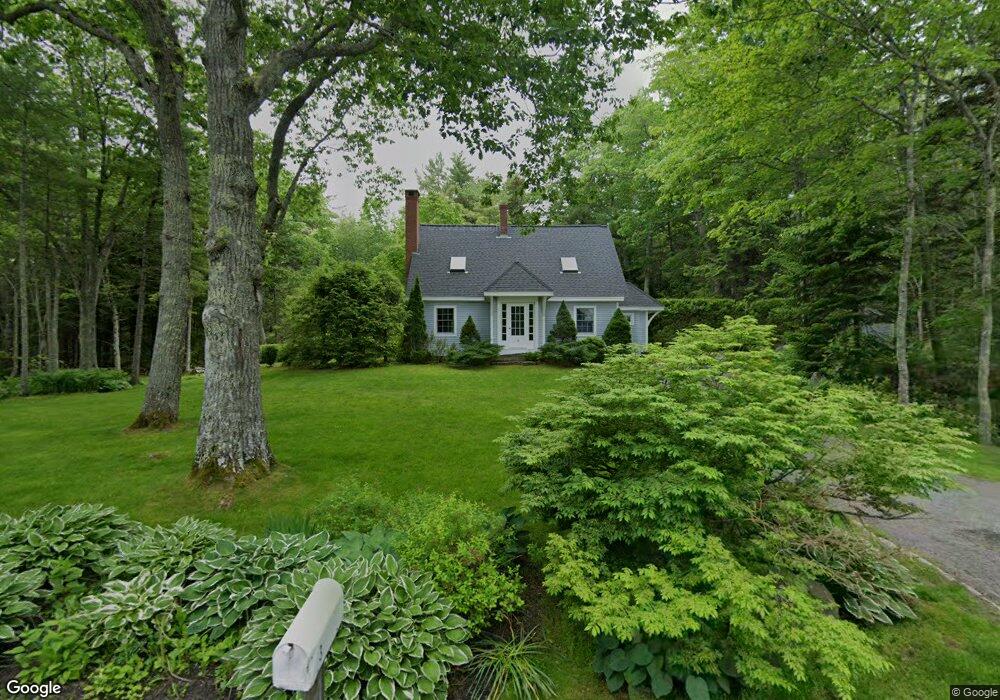
16 Maple St Rockport, ME 04856
Estimated Value: $599,000 - $897,000
3
Beds
2
Baths
1,762
Sq Ft
$433/Sq Ft
Est. Value
About This Home
This home is located at 16 Maple St, Rockport, ME 04856 and is currently estimated at $762,250, approximately $432 per square foot. 16 Maple St is a home located in Knox County with nearby schools including Camden-Rockport Elementary School, Camden-Rockport Middle School, and Camden Hills Regional High School.
Ownership History
Date
Name
Owned For
Owner Type
Purchase Details
Closed on
May 5, 2006
Sold by
Bonzi Helen
Bought by
Avery Mark G and Avery Nissa
Current Estimated Value
Home Financials for this Owner
Home Financials are based on the most recent Mortgage that was taken out on this home.
Original Mortgage
$475,000
Outstanding Balance
$274,155
Interest Rate
6.34%
Mortgage Type
Purchase Money Mortgage
Estimated Equity
$488,095
Create a Home Valuation Report for This Property
The Home Valuation Report is an in-depth analysis detailing your home's value as well as a comparison with similar homes in the area
Home Values in the Area
Average Home Value in this Area
Purchase History
| Date | Buyer | Sale Price | Title Company |
|---|---|---|---|
| Avery Mark G | -- | -- |
Source: Public Records
Mortgage History
| Date | Status | Borrower | Loan Amount |
|---|---|---|---|
| Open | Avery Mark G | $475,000 |
Source: Public Records
Tax History
| Year | Tax Paid | Tax Assessment Tax Assessment Total Assessment is a certain percentage of the fair market value that is determined by local assessors to be the total taxable value of land and additions on the property. | Land | Improvement |
|---|---|---|---|---|
| 2024 | $10,125 | $710,500 | $269,500 | $441,000 |
| 2023 | $8,988 | $710,500 | $269,500 | $441,000 |
| 2022 | $8,189 | $530,000 | $209,700 | $320,300 |
| 2021 | $7,096 | $416,200 | $198,300 | $217,900 |
| 2020 | $6,996 | $416,200 | $198,300 | $217,900 |
| 2019 | $7,096 | $416,200 | $198,300 | $217,900 |
| 2018 | $6,692 | $416,200 | $198,300 | $217,900 |
| 2017 | $6,139 | $416,200 | $198,300 | $217,900 |
| 2016 | $6,081 | $416,200 | $198,300 | $217,900 |
| 2015 | $5,848 | $416,200 | $198,300 | $217,900 |
| 2014 | $5,569 | $428,700 | $191,500 | $237,200 |
| 2013 | $5,440 | $428,700 | $191,500 | $237,200 |
Source: Public Records
Map
Nearby Homes
- 360 Commercial St
- 48 Sea St
- 1 Ship St
- 8 Ship St
- 26 Old Nutt Farm Rd
- 10 Summer St Unit 7
- 6 Summer St
- 80 Hayfield Way
- 3 Sea Light Ln
- 9 Rockport Woods
- 200 Mistic Ave
- 36 Roxmont Rd
- Lot #19 Greenfield Dr
- Lot #23 Greenfield Dr
- Lot 2 Roxmont Rd
- Lot 1 Roxmont Rd
- 17 John St
- 34 Curtis Ave
- 12 Hilltop Dr Unit 12
- 15 Hilltop Dr Unit 15
Your Personal Tour Guide
Ask me questions while you tour the home.