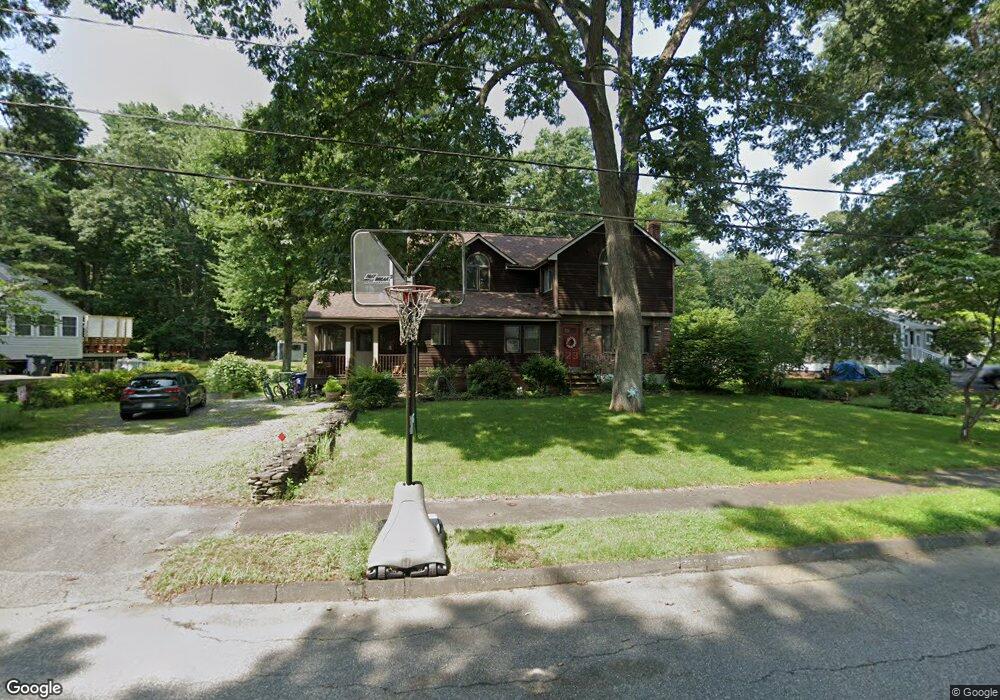
16 Moore St Wilmington, MA 01887
Estimated Value: $595,000 - $915,000
4
Beds
2
Baths
2,400
Sq Ft
$324/Sq Ft
Est. Value
About This Home
This home is located at 16 Moore St, Wilmington, MA 01887 and is currently estimated at $778,629, approximately $324 per square foot. 16 Moore St is a home located in Middlesex County with nearby schools including Wilmington Middle School, Wilmington High School, and Abundant Life Christian School and Childcare.
Ownership History
Date
Name
Owned For
Owner Type
Purchase Details
Closed on
Nov 14, 2008
Sold by
Welch Joan F Est and Welch
Bought by
Taylor Sally
Current Estimated Value
Home Financials for this Owner
Home Financials are based on the most recent Mortgage that was taken out on this home.
Original Mortgage
$372,847
Interest Rate
6.13%
Mortgage Type
VA
Create a Home Valuation Report for This Property
The Home Valuation Report is an in-depth analysis detailing your home's value as well as a comparison with similar homes in the area
Purchase History
| Date | Buyer | Sale Price | Title Company |
|---|---|---|---|
| Taylor Sally | $365,000 | -- | |
| Taylor Sally | $365,000 | -- |
Source: Public Records
Mortgage History
| Date | Status | Borrower | Loan Amount |
|---|---|---|---|
| Open | Taylor Sally | $386,855 | |
| Closed | Taylor Sally | $372,847 |
Source: Public Records
Tax History
| Year | Tax Paid | Tax Assessment Tax Assessment Total Assessment is a certain percentage of the fair market value that is determined by local assessors to be the total taxable value of land and additions on the property. | Land | Improvement |
|---|---|---|---|---|
| 2025 | $7,971 | $696,200 | $312,900 | $383,300 |
| 2024 | $7,826 | $684,700 | $312,900 | $371,800 |
| 2023 | $7,587 | $635,400 | $284,500 | $350,900 |
| 2022 | $7,134 | $547,500 | $237,000 | $310,500 |
| 2021 | $7,079 | $511,500 | $215,400 | $296,100 |
| 2020 | $6,753 | $497,300 | $215,400 | $281,900 |
| 2019 | $6,560 | $477,100 | $205,100 | $272,000 |
| 2018 | $6,427 | $446,000 | $195,400 | $250,600 |
| 2017 | $6,365 | $440,500 | $195,400 | $245,100 |
| 2016 | $5,957 | $407,200 | $186,200 | $221,000 |
| 2015 | $5,745 | $399,800 | $186,200 | $213,600 |
| 2014 | $5,380 | $377,800 | $177,400 | $200,400 |
Source: Public Records
Map
Nearby Homes
Your Personal Tour Guide
Ask me questions while you tour the home.