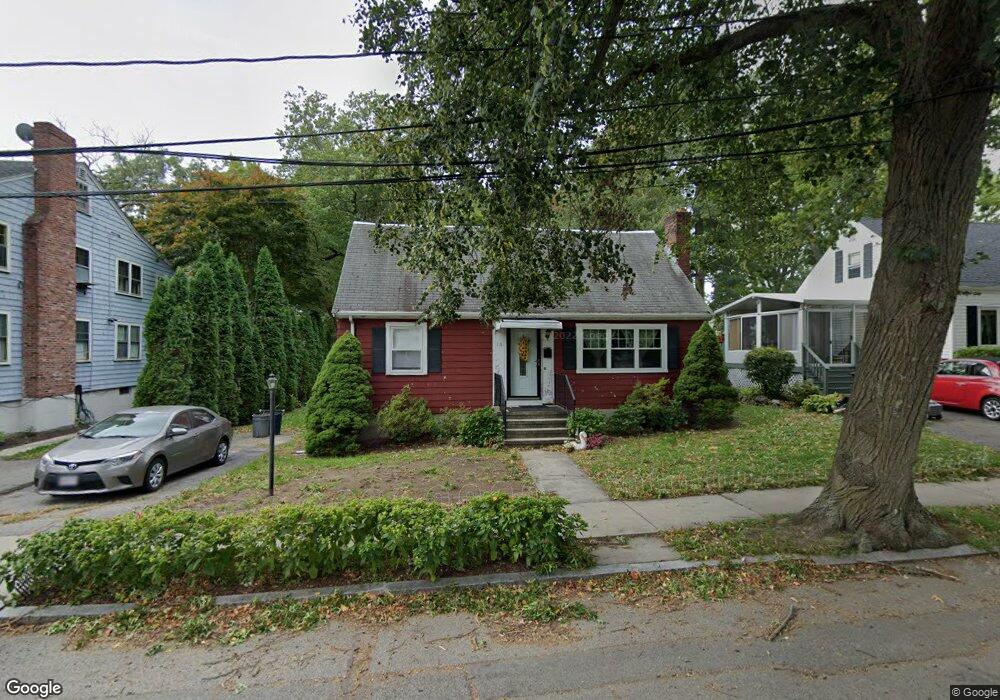
16 Robken Rd Roslindale, MA 02131
Roslindale NeighborhoodEstimated Value: $792,000 - $925,000
About This Home
This home is located at 16 Robken Rd, Roslindale, MA 02131 and is currently estimated at $856,574, approximately $617 per square foot. 16 Robken Rd is a home located in Suffolk County with nearby schools including Brooke Charter School Roslindale, Holy Name Parish School, and St. Clare High School.
Ownership History
We collect this data history from publicly available records. To have your information removed, we recommend requesting removal directly through your county’s website.
Purchase Details
Home Financials for this Owner
Home Financials are based on the most recent Mortgage that was taken out on this home.Purchase Details
Purchase Details
Home Values in the Area
Average Home Value in this Area
Purchase History
We collect this data history from publicly available records. To have your information removed, we recommend requesting removal directly through your county’s website.
| Date | Buyer | Sale Price | Title Company |
|---|---|---|---|
| $139,000 | -- | ||
| $73,500 | -- | ||
| $44,000 | -- |
Mortgage History
We collect this data history from publicly available records. To have your information removed, we recommend requesting removal directly through your county’s website.
| Date | Status | Borrower | Loan Amount |
|---|---|---|---|
| Open | $15,000 | ||
| Open | $80,000 | ||
| Closed | $111,200 | ||
| Previous Owner | $60,000 |
Tax History
We collect this data history from publicly available records. To have your information removed, we recommend requesting removal directly through your county’s website.
| Year | Tax Paid | Tax Assessment Tax Assessment Total Assessment is a certain percentage of the fair market value that is determined by local assessors to be the total taxable value of land and additions on the property. | Land | Improvement |
|---|---|---|---|---|
| 2025 | $7,757 | $669,900 | $237,100 | $432,800 |
| 2024 | $7,243 | $664,500 | $242,000 | $422,500 |
| 2023 | $7,137 | $664,500 | $242,000 | $422,500 |
| 2022 | $6,455 | $593,300 | $216,100 | $377,200 |
| 2021 | $6,214 | $582,400 | $216,100 | $366,300 |
| 2020 | $5,313 | $503,100 | $199,500 | $303,600 |
| 2019 | $4,910 | $465,800 | $166,100 | $299,700 |
| 2018 | $4,522 | $431,500 | $166,100 | $265,400 |
| 2017 | $4,570 | $431,500 | $166,100 | $265,400 |
| 2016 | $4,608 | $418,900 | $166,100 | $252,800 |
| 2015 | $4,687 | $387,000 | $161,400 | $225,600 |
| 2014 | $4,426 | $351,800 | $161,400 | $190,400 |
Map
- 136 Weld St
- 11 Colby Rd
- 52 Walter St
- 2 Weld Hill St Unit 203
- 2 Weld Hill St Unit PH3
- 2 Weld Hill St Unit 201
- 46 Symmes St Unit 3
- 48 Farquhar St
- 23 Symmes St
- 16 Primrose St Unit 3
- 101 Fletcher St Unit 1
- 1487 Centre St Unit 2
- 8 Mendum St
- 16 Ravenna Rd
- 16 Arborough Rd Unit 2
- 16 Arborough Rd Unit 1
- 73 Bradfield Ave Unit 1
- 40 Arborough Rd
- 1536 Centre St Unit 1
- 15 S Fairview St Unit 3
Ask me questions while you tour the home.