16 Scadding St Taunton, MA 02780
Prospect Hill NeighborhoodEstimated Value: $429,000 - $503,000
2
Beds
1
Bath
1,120
Sq Ft
$407/Sq Ft
Est. Value
About This Home
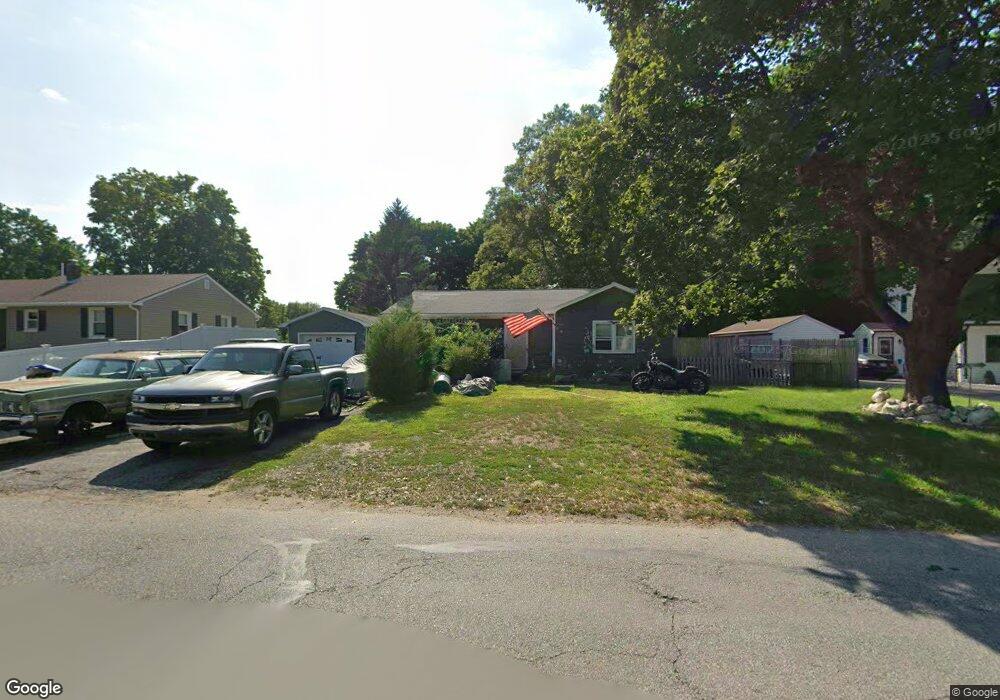
This home is located at 16 Scadding St, Taunton, MA 02780 and is currently estimated at $455,408, approximately $406 per square foot. 16 Scadding St is a home located in Bristol County with nearby schools including Hopewell, Benjamin Friedman Middle School, and Taunton High School.
Ownership History
Date
Name
Owned For
Owner Type
Purchase Details
Closed on
Nov 20, 2025
Sold by
Grainger Geraldine
Bought by
Grainger Jefferson
Current Estimated Value
Purchase Details
Closed on
Jun 26, 2008
Sold by
Grainger Geraldine
Bought by
Grainger Geraldine
Purchase Details
Closed on
Sep 29, 2004
Sold by
Rogers Joseph
Bought by
Grainger Geraldine
Create a Home Valuation Report for This Property
The Home Valuation Report is an in-depth analysis detailing your home's value as well as a comparison with similar homes in the area
Home Values in the Area
Average Home Value in this Area
Purchase History
We collect this data history from publicly available records. To have your information removed, we recommend requesting removal directly through your county’s website.
| Date | Buyer | Sale Price | Title Company |
|---|---|---|---|
| Grainger Jefferson | -- | -- | |
| Grainger Geraldine | -- | -- | |
| Grainger Geraldine J | -- | -- | |
| Grainger Geraldine | -- | -- | |
| Grainger Geraldine J | -- | -- |
Source: Public Records
Tax History
| Year | Tax Paid | Tax Assessment Tax Assessment Total Assessment is a certain percentage of the fair market value that is determined by local assessors to be the total taxable value of land and additions on the property. | Land | Improvement |
|---|---|---|---|---|
| 2025 | $4,191 | $383,100 | $136,600 | $246,500 |
| 2024 | $3,944 | $352,500 | $136,600 | $215,900 |
| 2023 | $3,970 | $329,500 | $142,900 | $186,600 |
| 2022 | $3,663 | $277,900 | $110,800 | $167,100 |
| 2021 | $3,601 | $253,600 | $100,700 | $152,900 |
| 2020 | $3,593 | $241,800 | $100,700 | $141,100 |
| 2019 | $3,648 | $231,500 | $100,700 | $130,800 |
| 2018 | $3,789 | $217,300 | $101,700 | $115,600 |
| 2017 | $3,285 | $209,100 | $96,400 | $112,700 |
| 2016 | $3,166 | $201,900 | $93,600 | $108,300 |
| 2015 | $3,041 | $202,600 | $93,000 | $109,600 |
| 2014 | $2,918 | $199,700 | $93,000 | $106,700 |
Source: Public Records
Map
Nearby Homes
Your Personal Tour Guide
Ask me questions while you tour the home.