Estimated Value: $331,972 - $434,000
Studio
--
Bath
756
Sq Ft
$528/Sq Ft
Est. Value
About This Home
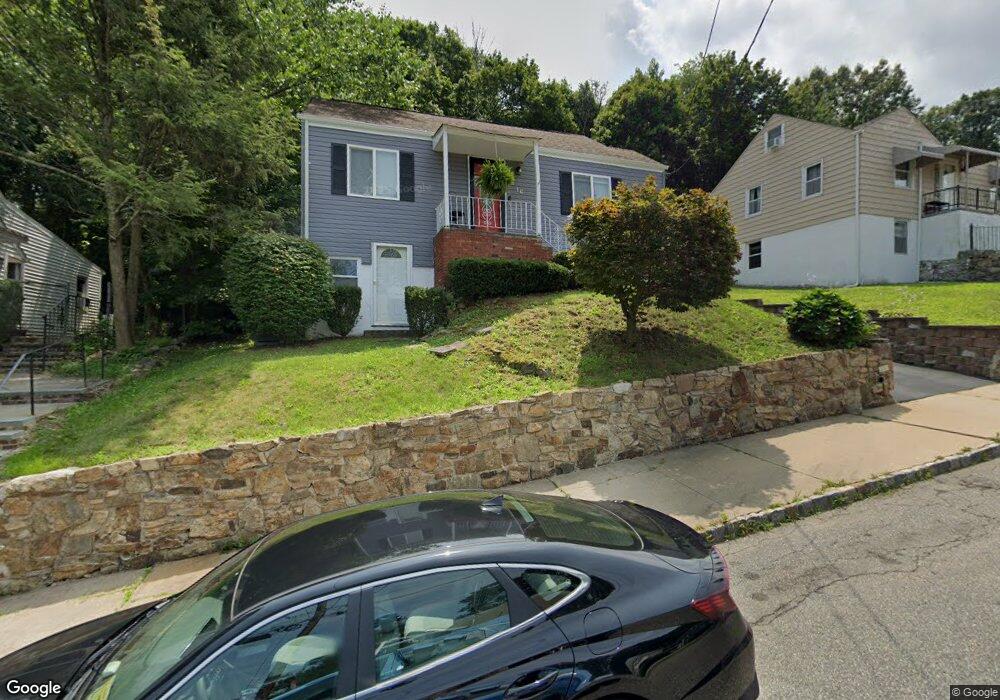
This home is located at 16 South St, Dover, NJ 07801 and is currently estimated at $399,493, approximately $528 per square foot. 16 South St is a home located in Morris County with nearby schools including Dover Middle School, Dover High School, and Apple Montessori Schools and Camps - Randolph.
Ownership History
Date
Name
Owned For
Owner Type
Purchase Details
Closed on
May 25, 2004
Sold by
Machado Gloria
Bought by
Martinez Martha and Montana Victor
Current Estimated Value
Home Financials for this Owner
Home Financials are based on the most recent Mortgage that was taken out on this home.
Original Mortgage
$228,000
Outstanding Balance
$109,749
Interest Rate
5.88%
Estimated Equity
$289,744
Purchase Details
Closed on
Feb 18, 1997
Sold by
Steinbrecher Sandra
Bought by
Machado Gloria and Machado Eugene
Purchase Details
Closed on
Feb 12, 1997
Sold by
Va
Bought by
Steinbrecher Sandra
Create a Home Valuation Report for This Property
The Home Valuation Report is an in-depth analysis detailing your home's value as well as a comparison with similar homes in the area
Home Values in the Area
Average Home Value in this Area
Purchase History
We collect this data history from publicly available records. To have your information removed, we recommend requesting removal directly through your county’s website.
| Date | Buyer | Sale Price | Title Company |
|---|---|---|---|
| Martinez Martha | $240,000 | -- | |
| Machado Gloria | $73,500 | -- | |
| Steinbrecher Sandra | $35,020 | -- |
Source: Public Records
Mortgage History
We collect this data history from publicly available records. To have your information removed, we recommend requesting removal directly through your county’s website.
| Date | Status | Borrower | Loan Amount |
|---|---|---|---|
| Open | Martinez Martha | $228,000 |
Source: Public Records
Tax History
| Year | Tax Paid | Tax Assessment Tax Assessment Total Assessment is a certain percentage of the fair market value that is determined by local assessors to be the total taxable value of land and additions on the property. | Land | Improvement |
|---|---|---|---|---|
| 2025 | $5,990 | $183,000 | $90,000 | $93,000 |
| 2024 | $5,777 | $183,000 | $90,000 | $93,000 |
| 2023 | $5,777 | $183,000 | $90,000 | $93,000 |
| 2022 | $5,312 | $183,000 | $90,000 | $93,000 |
| 2021 | $5,312 | $183,000 | $90,000 | $93,000 |
| 2020 | $5,206 | $183,000 | $90,000 | $93,000 |
| 2019 | $4,990 | $183,000 | $90,000 | $93,000 |
| 2018 | $4,716 | $183,000 | $90,000 | $93,000 |
| 2017 | $4,502 | $183,000 | $90,000 | $93,000 |
| 2016 | $4,396 | $183,000 | $90,000 | $93,000 |
| 2015 | $4,905 | $238,700 | $136,700 | $102,000 |
| 2014 | $4,855 | $238,700 | $136,700 | $102,000 |
Source: Public Records
Map
Nearby Homes
- 19 South St
- 58 William St
- 43 Everett Dr
- 15 Cross St
- 79 Ann St
- 109 Quaker Ave
- 5 A&B Dewey St
- 38 E Dickerson St
- 6-16 E Blackwell St Unit 2D
- 6-16 E Blackwell St Unit 2C
- 142 W Blackwell St
- 44 Linwood Ave
- 82 Pequannock St Unit 84
- 25 Passaic St
- 113 Pequannock St
- 10 Toye St
- 52 Central Ave
- 146 N Sussex St
- 25 Roosevelt Ave
- 7 Adams Ave Unit 11
Your Personal Tour Guide
Ask me questions while you tour the home.