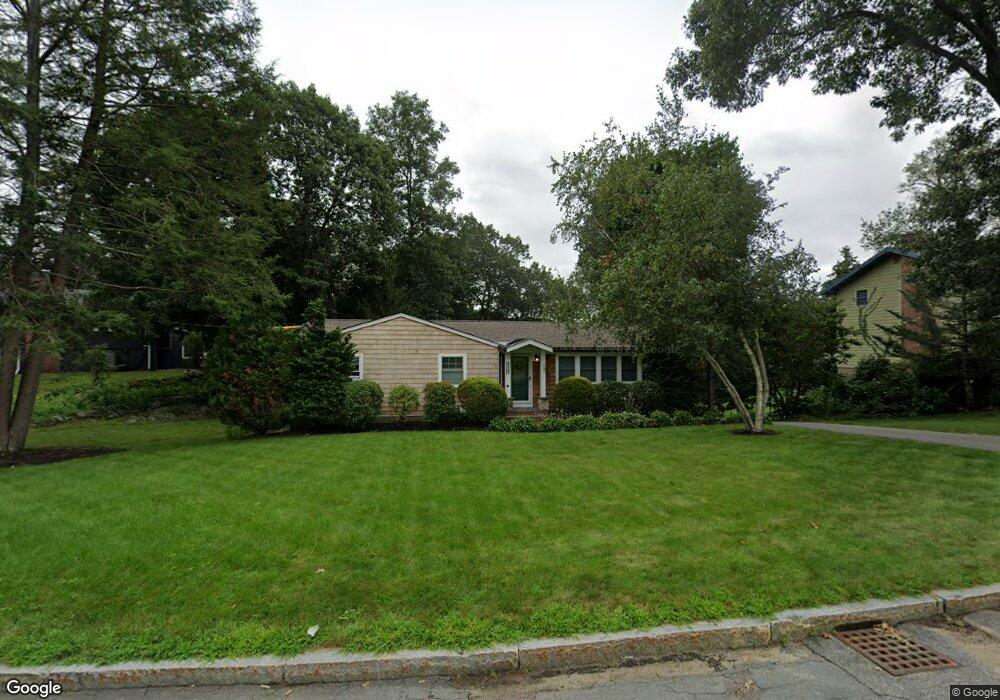
16 Squire Rd Winchester, MA 01890
West Side NeighborhoodEstimated Value: $1,210,813 - $1,393,000
4
Beds
3
Baths
2,043
Sq Ft
$633/Sq Ft
Est. Value
About This Home
This home is located at 16 Squire Rd, Winchester, MA 01890 and is currently estimated at $1,292,953, approximately $632 per square foot. 16 Squire Rd is a home located in Middlesex County with nearby schools including Vinson-Owen Elementary School, McCall Middle School, and Winchester High School.
Ownership History
Date
Name
Owned For
Owner Type
Purchase Details
Closed on
Dec 6, 2019
Sold by
Gilgun Sharon C
Bought by
Gilgun Frederick V
Current Estimated Value
Home Financials for this Owner
Home Financials are based on the most recent Mortgage that was taken out on this home.
Original Mortgage
$50,000
Outstanding Balance
$43,600
Interest Rate
3.7%
Mortgage Type
Balloon
Estimated Equity
$1,249,353
Purchase Details
Closed on
Jul 31, 2002
Sold by
Ciampa Antonio and Ciampa Elizabeth J
Bought by
Gilson Frederick V and Gilgun Sharon C
Home Financials for this Owner
Home Financials are based on the most recent Mortgage that was taken out on this home.
Original Mortgage
$260,000
Interest Rate
6.64%
Mortgage Type
Purchase Money Mortgage
Purchase Details
Closed on
Dec 10, 1999
Sold by
Paquette Normand J Est and Paquette
Bought by
Ciampa Antonio and Ciampa Elizabeth J
Create a Home Valuation Report for This Property
The Home Valuation Report is an in-depth analysis detailing your home's value as well as a comparison with similar homes in the area
Home Values in the Area
Average Home Value in this Area
Purchase History
| Date | Buyer | Sale Price | Title Company |
|---|---|---|---|
| Gilgun Frederick V | -- | None Available | |
| Gilson Frederick V | $546,000 | -- | |
| Gilson Frederick | $546,000 | -- | |
| Ciampa Antonio | $350,000 | -- |
Source: Public Records
Mortgage History
| Date | Status | Borrower | Loan Amount |
|---|---|---|---|
| Open | Gilgun Frederick V | $50,000 | |
| Open | Gilgun Frederick V | $640,000 | |
| Previous Owner | Ciampa Antonio | $290,000 | |
| Previous Owner | Ciampa Antonio | $290,000 | |
| Previous Owner | Gilson Frederick | $260,000 |
Source: Public Records
Tax History
| Year | Tax Paid | Tax Assessment Tax Assessment Total Assessment is a certain percentage of the fair market value that is determined by local assessors to be the total taxable value of land and additions on the property. | Land | Improvement |
|---|---|---|---|---|
| 2025 | $120 | $1,080,400 | $799,800 | $280,600 |
| 2024 | $11,778 | $1,039,500 | $759,800 | $279,700 |
| 2023 | $10,882 | $922,200 | $659,800 | $262,400 |
| 2022 | $10,741 | $858,600 | $599,800 | $258,800 |
| 2021 | $9,989 | $778,600 | $519,800 | $258,800 |
| 2020 | $9,523 | $768,600 | $509,800 | $258,800 |
| 2019 | $8,703 | $718,700 | $459,900 | $258,800 |
| 2018 | $8,427 | $691,300 | $437,900 | $253,400 |
| 2017 | $8,489 | $691,300 | $437,900 | $253,400 |
| 2016 | $7,792 | $667,100 | $429,900 | $237,200 |
| 2015 | $7,734 | $637,100 | $399,900 | $237,200 |
| 2014 | $7,781 | $614,600 | $389,900 | $224,700 |
Source: Public Records
Map
Nearby Homes
- 12 Wincrest Dr
- 12 Thornberry Rd
- 15 Gershon Way Unit 15
- 20 Amberwood Dr
- 2 Gershon Way Unit 2
- 2 Gershon Way
- 94 Johnson Rd
- 114 Johnson Rd
- 54 Johnson Rd
- 44 Tyler Rd
- 257 High St
- 276 High St
- 22 Tyler Rd
- 15 Peachtree Rd
- 273 Cambridge Rd Unit 408
- 30 Whipple Rd
- 29 Pilgrim Dr
- 206 Russell St
- 6 Crawford Dr
- 1 Plymouth Rd
Your Personal Tour Guide
Ask me questions while you tour the home.