16 W Jack St Hazlet, NJ 07730
Hazlet AreaEstimated Value: $369,000 - $530,000
About This Home
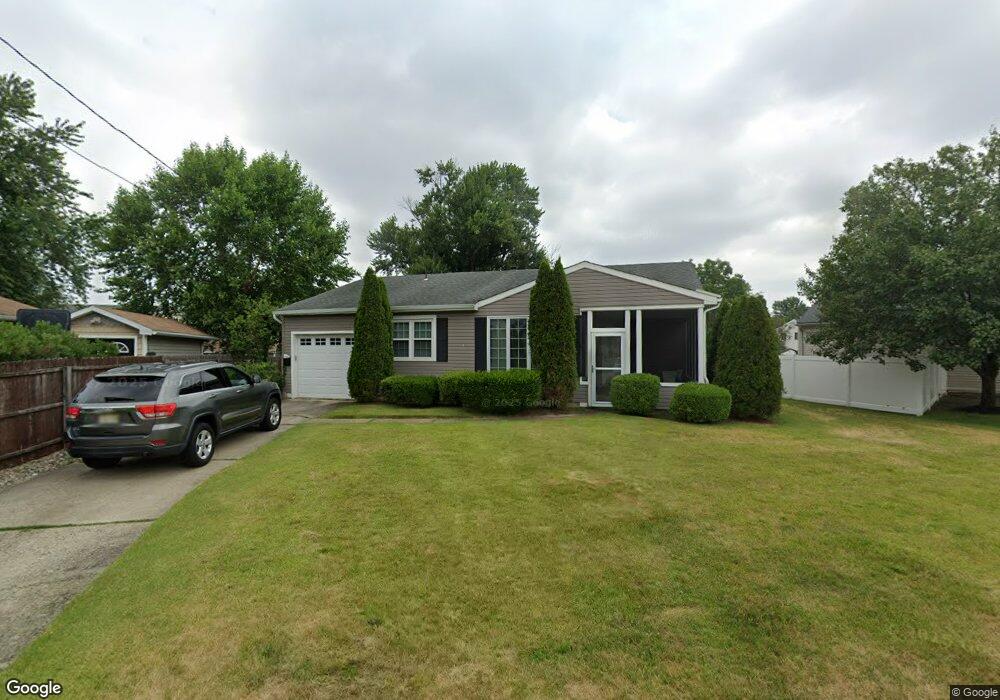
This home is located at 16 W Jack St, Hazlet, NJ 07730 and is currently estimated at $479,980, approximately $466 per square foot. 16 W Jack St is a home located in Monmouth County with nearby schools including Raritan High School, Icob Academy, and St. Joseph Elementary School.
Ownership History
We collect this data history from publicly available records. To have your information removed, we recommend requesting removal directly through your county’s website.
Purchase Details
Purchase Details
Purchase Details
Home Values in the Area
Average Home Value in this Area
Purchase History
We collect this data history from publicly available records. To have your information removed, we recommend requesting removal directly through your county’s website.
| Date | Buyer | Sale Price | Title Company |
|---|---|---|---|
| -- | None Listed On Document | ||
| -- | None Available | ||
| -- | -- |
Tax History
We collect this data history from publicly available records. To have your information removed, we recommend requesting removal directly through your county’s website.
| Year | Tax Paid | Tax Assessment Tax Assessment Total Assessment is a certain percentage of the fair market value that is determined by local assessors to be the total taxable value of land and additions on the property. | Land | Improvement |
|---|---|---|---|---|
| 2026 | $9,440 | $526,300 | $397,800 | $128,500 |
| 2025 | $9,440 | $473,400 | $350,800 | $122,600 |
| 2024 | $8,586 | $420,900 | $298,800 | $122,100 |
| 2023 | $8,586 | $401,800 | $280,800 | $121,000 |
| 2022 | $7,941 | $340,400 | $233,800 | $106,600 |
| 2021 | $7,941 | $309,600 | $214,800 | $94,800 |
| 2020 | $7,808 | $302,400 | $209,800 | $92,600 |
| 2019 | $7,525 | $286,900 | $194,800 | $92,100 |
| 2018 | $7,343 | $277,600 | $189,800 | $87,800 |
| 2017 | $6,901 | $260,900 | $175,800 | $85,100 |
| 2016 | $6,819 | $258,800 | $175,800 | $83,000 |
| 2015 | $6,115 | $251,700 | $170,800 | $80,900 |
| 2014 | $5,437 | $211,900 | $134,800 | $77,100 |
Map
- 16 W Susan St
- 17 Coach Dr
- 48 Pine Creek Village
- 30 Pine Creek Village
- 4 David St
- 6 Tall Oaks Dr
- 12 Ann Ct
- 9 Monique Cir
- 6 Joyce Place
- 19 Gregory St
- 2108 Florence Ave
- 20 Bromley Dr
- 52 Monique Cir
- 68 Alex Ct
- 31 Monique Cir
- 2 Justin Ct
- 21 Park Ave
- 12 Raritan Ave
- 4 231 Atlantic St Unit 39
- 231 Atlantic St Unit 30
Ask me questions while you tour the home.