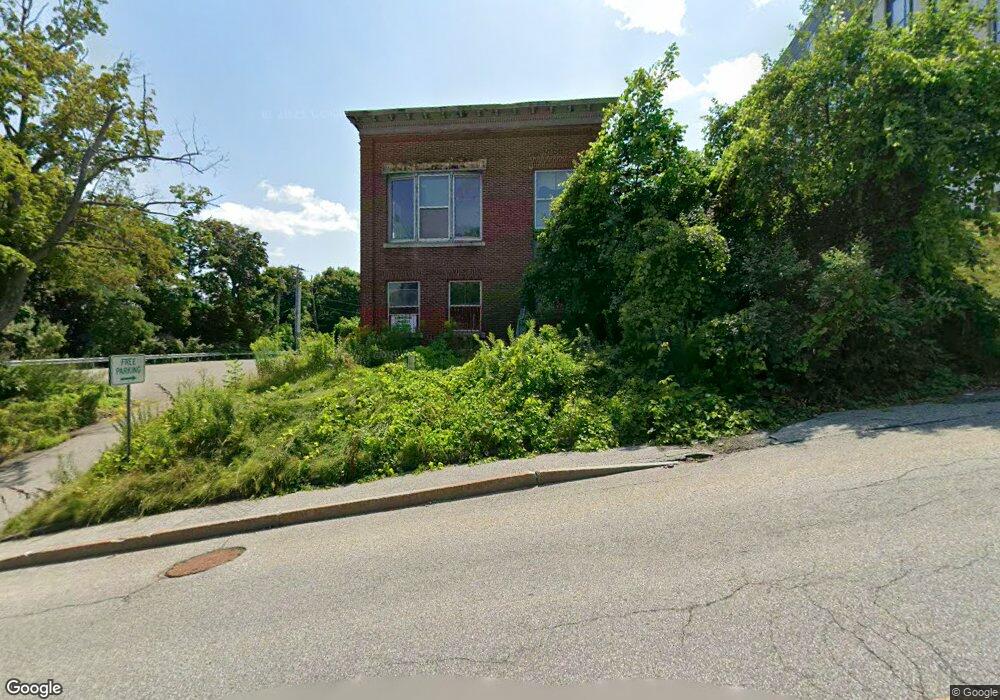
16 Winthrop St Augusta, ME 04330
Estimated Value: $344,028
Studio
2
Baths
5,998
Sq Ft
$57/Sq Ft
Est. Value
About This Home
This home is located at 16 Winthrop St, Augusta, ME 04330 and is currently priced at $344,028, approximately $57 per square foot. 16 Winthrop St is a home located in Kennebec County with nearby schools including Cony Middle School, Cony School, and Maine Virtual Academy.
Ownership History
Date
Name
Owned For
Owner Type
Purchase Details
Closed on
Nov 4, 2020
Sold by
16 Winthrop Street Llc
Bought by
Sj Valley Llc
Current Estimated Value
Purchase Details
Closed on
Sep 17, 2012
Sold by
Me Democratic Comm Corp
Bought by
16 Winthrop Street Llc
Purchase Details
Closed on
Apr 5, 2005
Sold by
Maine Forest Products
Bought by
Maine Democratic Committe
Home Financials for this Owner
Home Financials are based on the most recent Mortgage that was taken out on this home.
Original Mortgage
$232,125
Interest Rate
5.61%
Mortgage Type
Commercial
Create a Home Valuation Report for This Property
The Home Valuation Report is an in-depth analysis detailing your home's value as well as a comparison with similar homes in the area
Home Values in the Area
Average Home Value in this Area
Purchase History
| Date | Buyer | Sale Price | Title Company |
|---|---|---|---|
| Sj Valley Llc | -- | None Available | |
| Sj Valley Llc | -- | None Available | |
| Sj Valley Llc | -- | None Available | |
| 16 Winthrop Street Llc | -- | -- | |
| 16 Winthrop Street Llc | -- | -- | |
| Maine Democratic Committe | -- | -- | |
| Maine Democratic Committe | -- | -- | |
| Maine Democratic Committe | -- | -- |
Source: Public Records
Mortgage History
| Date | Status | Borrower | Loan Amount |
|---|---|---|---|
| Previous Owner | Maine Democratic Committe | $232,125 |
Source: Public Records
Tax History
| Year | Tax Paid | Tax Assessment Tax Assessment Total Assessment is a certain percentage of the fair market value that is determined by local assessors to be the total taxable value of land and additions on the property. | Land | Improvement |
|---|---|---|---|---|
| 2025 | $7,369 | $302,000 | $72,500 | $229,500 |
| 2024 | $7,188 | $302,000 | $72,500 | $229,500 |
| 2023 | $6,934 | $302,000 | $72,500 | $229,500 |
| 2022 | $6,620 | $302,000 | $72,500 | $229,500 |
| 2021 | $6,324 | $302,000 | $72,500 | $229,500 |
| 2020 | $6,979 | $333,300 | $72,500 | $260,800 |
| 2019 | $6,989 | $333,300 | $72,500 | $260,800 |
| 2018 | $6,891 | $333,300 | $72,500 | $260,800 |
| 2017 | $6,793 | $333,300 | $72,500 | $260,800 |
| 2016 | $6,596 | $333,300 | $72,500 | $260,800 |
| 2015 | $6,466 | $333,300 | $72,500 | $260,800 |
| 2014 | $6,223 | $333,300 | $72,500 | $260,800 |
Source: Public Records
Map
Nearby Homes
Your Personal Tour Guide
Ask me questions while you tour the home.