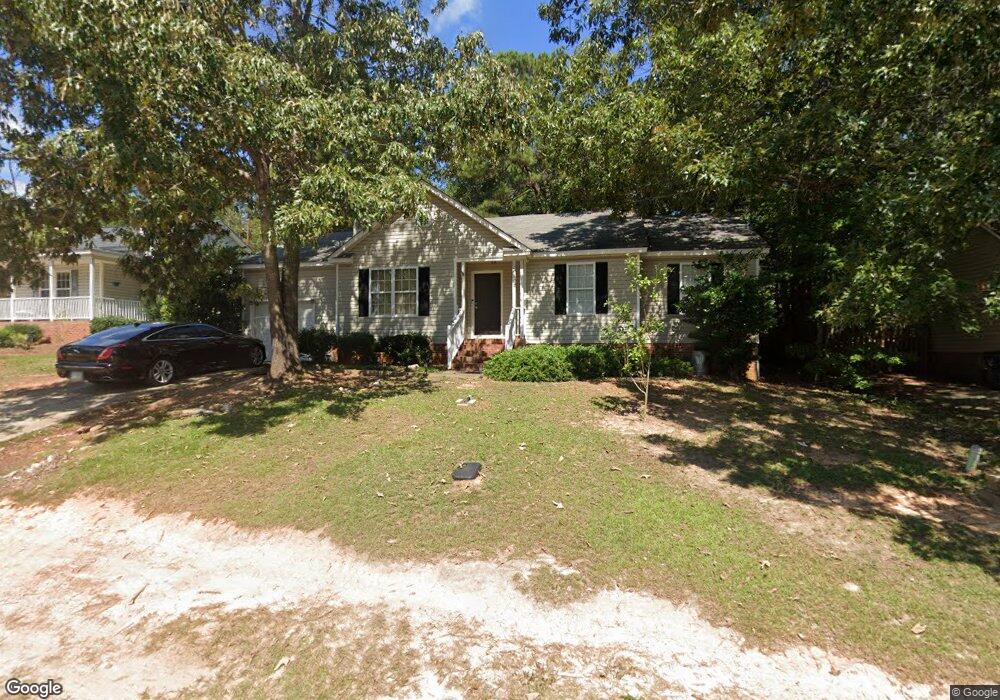
160 Firebridge Dr Chapin, SC 29036
Estimated Value: $197,159 - $236,000
About This Home
This home is located at 160 Firebridge Dr, Chapin, SC 29036 and is currently estimated at $213,040, approximately $169 per square foot. 160 Firebridge Dr is a home located in Lexington County with nearby schools including Chapin Elementary School, Chapin Intermediate, and Chapin High School.
Ownership History
We collect this data history from publicly available records. To have your information removed, we recommend requesting removal directly through your county’s website.
Purchase Details
Home Financials for this Owner
Home Financials are based on the most recent Mortgage that was taken out on this home.Purchase Details
Purchase Details
Home Financials for this Owner
Home Financials are based on the most recent Mortgage that was taken out on this home.Purchase Details
Home Values in the Area
Average Home Value in this Area
Purchase History
We collect this data history from publicly available records. To have your information removed, we recommend requesting removal directly through your county’s website.
| Date | Buyer | Sale Price | Title Company |
|---|---|---|---|
| -- | Os National Title | ||
| -- | None Available | ||
| -- | None Available | ||
| $16,000 | -- |
Mortgage History
We collect this data history from publicly available records. To have your information removed, we recommend requesting removal directly through your county’s website.
| Date | Status | Borrower | Loan Amount |
|---|---|---|---|
| Previous Owner | $3,280,000 | ||
| Previous Owner | $94,400 |
Tax History
We collect this data history from publicly available records. To have your information removed, we recommend requesting removal directly through your county’s website.
| Year | Tax Paid | Tax Assessment Tax Assessment Total Assessment is a certain percentage of the fair market value that is determined by local assessors to be the total taxable value of land and additions on the property. | Land | Improvement |
|---|---|---|---|---|
| 2024 | $3,638 | $7,278 | $1,413 | $5,865 |
| 2023 | $3,276 | $7,176 | $1,775 | $5,401 |
| 2020 | $3,107 | $7,176 | $1,775 | $5,401 |
| 2019 | $2,783 | $6,240 | $1,500 | $4,740 |
| 2018 | $2,658 | $6,240 | $1,500 | $4,740 |
| 2017 | $2,730 | $6,482 | $1,500 | $4,982 |
| 2016 | $2,711 | $6,481 | $1,500 | $4,981 |
| 2014 | $2,542 | $6,326 | $1,173 | $5,153 |
| 2013 | -- | $6,330 | $1,170 | $5,160 |
Map
- 3 Careton Ct
- 550 Griffon Dr
- 598 Griffon Dr
- 301 Amicks Ferry Rd
- 575 Griffon Dr
- 606 Griffon Dr
- 614 Griffon Dr
- 618 Griffon Dr
- 624 Griffon Dr
- 303 Lever Bottom Ct
- 405 Lever Hill Rd
- 54 Revelstone Way
- 536 Lever Hill Ct
- 316 Turkey Beard Ct
- 118 Pacific Ave
- 412 Murray Lindler Rd
- 0 E Boundary St
- 0 Amicks Ferry Rd
- 535 Sandbar Rd
- 1-B Saint Peters Church Rd
- 158 Firebridge Dr
- 156 Firebridge Dr
- 133 Fair Haven Way
- 162 Firebridge Dr
- 154 Firebridge Dr
- 135 Fair Haven Way
- 139 Fair Haven Way
- 131 Fair Haven Way
- 157 Firebridge Dr
- 159 Firebridge Dr
- 137 Fair Haven Way
- 155 Firebridge Dr
- 164 Firebridge Dr
- 129 Fair Haven Way
- 161 Firebridge Dr
- 152 Firebridge Dr
- 141 Fair Haven Way
- 127 Fair Haven Way
- 163 Firebridge Dr
- 166 Firebridge Dr
Ask me questions while you tour the home.