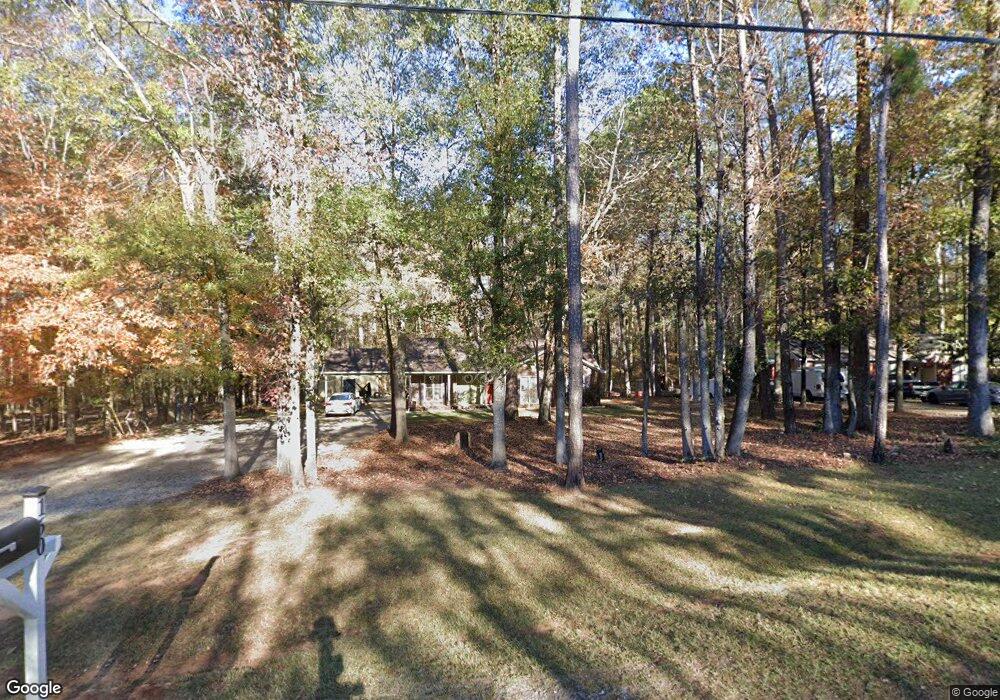
160 Grant Rd Cataula, GA 31804
Cataula NeighborhoodEstimated Value: $209,000 - $246,000
3
Beds
2
Baths
1,445
Sq Ft
$156/Sq Ft
Est. Value
About This Home
This home is located at 160 Grant Rd, Cataula, GA 31804 and is currently estimated at $225,960, approximately $156 per square foot. 160 Grant Rd is a home located in Harris County with nearby schools including Mulberry Creek Elementary School, Creekside School, and Harris County Carver Middle School.
Ownership History
Date
Name
Owned For
Owner Type
Purchase Details
Closed on
Apr 23, 2013
Sold by
Fisher Jacqueline G
Bought by
Fisher Jacqueline G and Burton Danielle S
Current Estimated Value
Home Financials for this Owner
Home Financials are based on the most recent Mortgage that was taken out on this home.
Original Mortgage
$94,594
Outstanding Balance
$65,938
Interest Rate
3.5%
Mortgage Type
FHA
Estimated Equity
$160,022
Purchase Details
Closed on
Mar 11, 2013
Sold by
Sec Of Housing & U
Bought by
Fisher Jacqueline G
Home Financials for this Owner
Home Financials are based on the most recent Mortgage that was taken out on this home.
Original Mortgage
$94,594
Outstanding Balance
$65,938
Interest Rate
3.5%
Mortgage Type
FHA
Estimated Equity
$160,022
Purchase Details
Closed on
Jun 5, 2012
Sold by
Bank Of America
Bought by
Sec Of Housing & Urban
Purchase Details
Closed on
Jul 27, 2005
Sold by
Lloyd Donna
Bought by
Stoe Richard and Stoe Melodie
Purchase Details
Closed on
Jun 4, 2003
Sold by
Etheridge Percy J and Etheridge Donna R
Bought by
Etheridge Donna R
Purchase Details
Closed on
Feb 10, 1995
Bought by
Etheridge Percy J and Etheridge Donna R
Create a Home Valuation Report for This Property
The Home Valuation Report is an in-depth analysis detailing your home's value as well as a comparison with similar homes in the area
Home Values in the Area
Average Home Value in this Area
Purchase History
| Date | Buyer | Sale Price | Title Company |
|---|---|---|---|
| Fisher Jacqueline G | -- | -- | |
| Fisher Jacqueline G | $80,760 | -- | |
| Sec Of Housing & Urban | $161,845 | -- | |
| Bank Of America | $161,845 | -- | |
| Stoe Richard | $117,000 | -- | |
| Etheridge Donna R | -- | -- | |
| Etheridge Percy J | $84,900 | -- |
Source: Public Records
Mortgage History
| Date | Status | Borrower | Loan Amount |
|---|---|---|---|
| Open | Fisher Jacqueline G | $94,594 |
Source: Public Records
Tax History
| Year | Tax Paid | Tax Assessment Tax Assessment Total Assessment is a certain percentage of the fair market value that is determined by local assessors to be the total taxable value of land and additions on the property. | Land | Improvement |
|---|---|---|---|---|
| 2025 | $1,758 | $79,250 | $7,961 | $71,289 |
| 2024 | $1,789 | $65,429 | $7,174 | $58,255 |
| 2023 | $1,330 | $65,517 | $7,174 | $58,343 |
| 2022 | $1,374 | $49,842 | $7,174 | $42,668 |
| 2021 | $1,402 | $49,180 | $7,174 | $42,006 |
| 2020 | $1,402 | $49,180 | $7,174 | $42,006 |
| 2019 | $1,353 | $49,180 | $7,174 | $42,006 |
| 2018 | $1,282 | $45,558 | $7,174 | $38,384 |
| 2017 | $1,282 | $45,558 | $7,174 | $38,384 |
| 2016 | $1,129 | $43,565 | $7,174 | $36,392 |
| 2015 | $1,131 | $43,565 | $7,174 | $36,392 |
| 2014 | $854 | $45,275 | $7,174 | $38,101 |
| 2013 | -- | $49,190 | $11,088 | $38,101 |
Source: Public Records
Map
Nearby Homes
- 13145 Ga Highway 315
- 476 Wildwood Plantation Dr
- 111 E Bon Acre Rd
- 79 Acorn Ct
- 226.04 Ac Kingsboro Rd
- 141 Voorhees Rd
- 909 Red Fox Ct
- 226.04+/-AC Kingsboro Rd
- 33 White Pine Dr
- 169 Cotton Ln
- 1268 Georgia 208
- 1578 Ga Highway 208
- 492 Mulberry Crossing Dr
- 111 Shadewood Dr
- 139 Shadewood Dr
- 385 Hudson Mill Cir
- 2074 Calhoun Rd
- 719 Harris Rd
- 3515 Ga Highway 208
- 395 Walker Rd
Your Personal Tour Guide
Ask me questions while you tour the home.