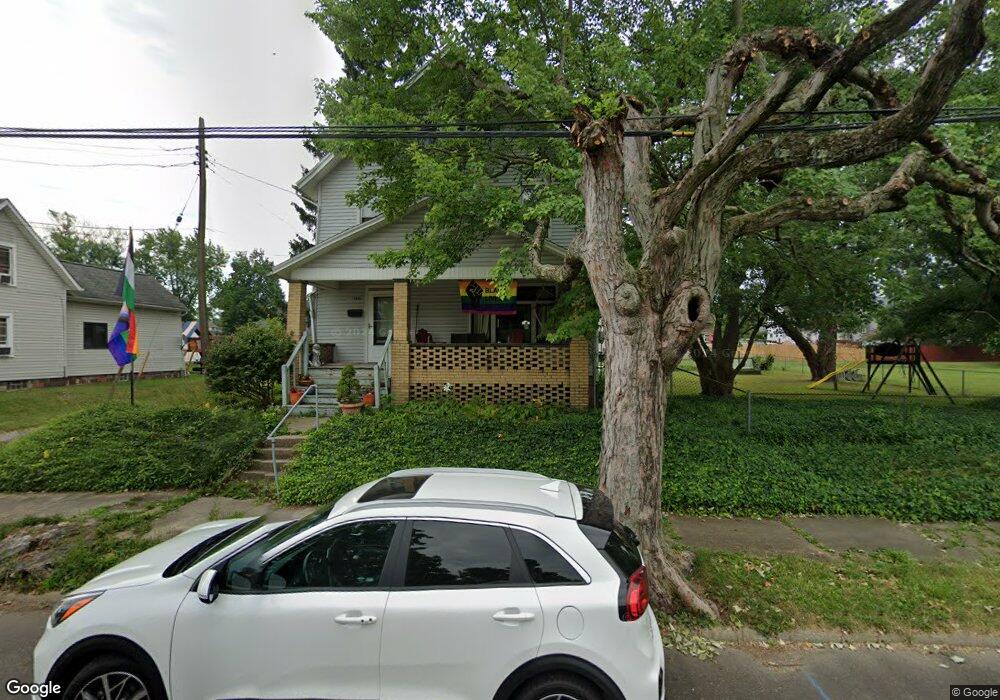
160 Selby St Alliance, OH 44601
Estimated Value: $99,198 - $127,000
About This Home
This home is located at 160 Selby St, Alliance, OH 44601 and is currently estimated at $112,550, approximately $76 per square foot. 160 Selby St is a home located in Stark County with nearby schools including Alliance Early Learning School, Alliance Intermediate School at Northside, and Alliance Middle School.
Ownership History
We collect this data history from publicly available records. To have your information removed, we recommend requesting removal directly through your county’s website.
Purchase Details
Home Financials for this Owner
Home Financials are based on the most recent Mortgage that was taken out on this home.Purchase Details
Purchase Details
Home Values in the Area
Average Home Value in this Area
Purchase History
We collect this data history from publicly available records. To have your information removed, we recommend requesting removal directly through your county’s website.
| Date | Buyer | Sale Price | Title Company |
|---|---|---|---|
| $40,000 | -- | ||
| -- | -- | ||
| -- | -- |
Mortgage History
We collect this data history from publicly available records. To have your information removed, we recommend requesting removal directly through your county’s website.
| Date | Status | Borrower | Loan Amount |
|---|---|---|---|
| Closed | $36,000 |
Tax History
We collect this data history from publicly available records. To have your information removed, we recommend requesting removal directly through your county’s website.
| Year | Tax Paid | Tax Assessment Tax Assessment Total Assessment is a certain percentage of the fair market value that is determined by local assessors to be the total taxable value of land and additions on the property. | Land | Improvement |
|---|---|---|---|---|
| 2025 | $1,561 | $26,400 | $5,570 | $20,830 |
| 2024 | $437 | $26,400 | $5,570 | $20,830 |
| 2023 | $2,682 | $19,250 | $5,530 | $13,720 |
| 2022 | $779 | $19,250 | $5,530 | $13,720 |
| 2021 | $779 | $19,250 | $5,530 | $13,720 |
| 2020 | $727 | $16,770 | $4,800 | $11,970 |
| 2019 | $717 | $16,780 | $4,800 | $11,980 |
| 2018 | $720 | $16,780 | $4,800 | $11,980 |
| 2017 | $553 | $12,680 | $3,220 | $9,460 |
| 2016 | $887 | $12,680 | $3,220 | $9,460 |
| 2015 | $563 | $12,680 | $3,220 | $9,460 |
| 2014 | $632 | $13,560 | $3,470 | $10,090 |
| 2013 | $315 | $13,560 | $3,470 | $10,090 |
Map
- 717 Garfield Ave
- 146 W Harrison St
- 105 W Ely St
- 244 N Park Ave
- 849 Walnut Ave
- 171 1/2 W Main St
- 1033 Walnut Ave
- 132 S Haines Ave
- 000 Meadowbrook Ave
- 11371 Walnut Ave NE
- 33 Parkway Blvd
- 1154 Meadowbrook Ave
- 456 W Broadway St
- 432 Johnson Ave
- 550 Johnson Ave
- 427 S Union Ave
- 479 W High St
- 421 S Park Ave
- 319 W Oxford St
- 0 Meadowbrook Ave NE
Ask me questions while you tour the home.