1609 Peach Cir Snyder, OK 73566
Estimated Value: $95,772 - $138,000
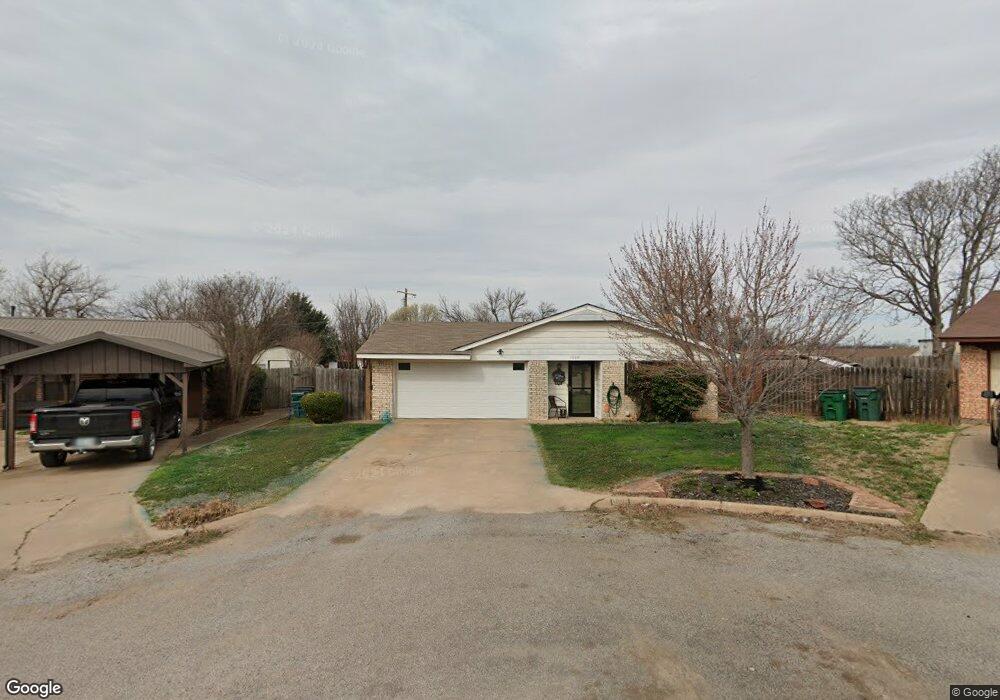
About This Home
This home is located at 1609 Peach Cir, Snyder, OK 73566 and is currently estimated at $114,943, approximately $85 per square foot. 1609 Peach Cir is a home located in Kiowa County with nearby schools including Snyder Elementary School and Snyder High School.
Ownership History
We collect this data history from publicly available records. To have your information removed, we recommend requesting removal directly through your county’s website.
Purchase Details
Purchase Details
Purchase Details
Purchase Details
Purchase Details
Purchase History
We collect this data history from publicly available records. To have your information removed, we recommend requesting removal directly through your county’s website.
| Date | Buyer | Sale Price | Title Company |
|---|---|---|---|
| -- | None Available | ||
| -- | -- | ||
| -- | -- | ||
| -- | Molly Jones | ||
| $55,000 | -- |
Tax History
We collect this data history from publicly available records. To have your information removed, we recommend requesting removal directly through your county’s website.
| Year | Tax Paid | Tax Assessment Tax Assessment Total Assessment is a certain percentage of the fair market value that is determined by local assessors to be the total taxable value of land and additions on the property. | Land | Improvement |
|---|---|---|---|---|
| 2025 | $714 | $8,578 | $141 | $8,437 |
| 2024 | $794 | $9,153 | $141 | $9,012 |
| 2023 | $786 | $9,056 | $141 | $8,915 |
| 2022 | $676 | $9,056 | $141 | $8,915 |
| 2021 | $676 | $9,056 | $141 | $8,915 |
| 2020 | $693 | $9,284 | $141 | $9,143 |
| 2019 | $693 | $9,273 | $141 | $9,132 |
| 2018 | $659 | $8,831 | $141 | $8,690 |
| 2017 | $711 | $9,559 | $141 | $9,418 |
| 2016 | $314 | $5,224 | $141 | $5,083 |
| 2015 | $332 | $5,453 | $141 | $5,312 |
| 2014 | $329 | $5,416 | $141 | $5,275 |
Map
- 1511 D St
- 1601 C St
- 1116 D St
- 306 10th St
- 602 D St
- N 2250 Rd
- TBD N 2250 Rd
- 22778 Highway 62b
- E 1670 Rd
- 16485 Highway 54
- 6543 NW 277th St
- SW Woodland Rd
- 000 E 1528 Rd
- 23070 County Road E173
- 404 Hereford St
- 20583 E County Road 158
- 20579 E County Road 158
- TBD SW Woodlawn Rd
- 22072 E 1500 Rd
- 72 Hidden Oaks Dr
Ask me questions while you tour the home.