1625 W Grant St Macomb, IL 61455
Estimated Value: $114,000 - $189,000
About This Home
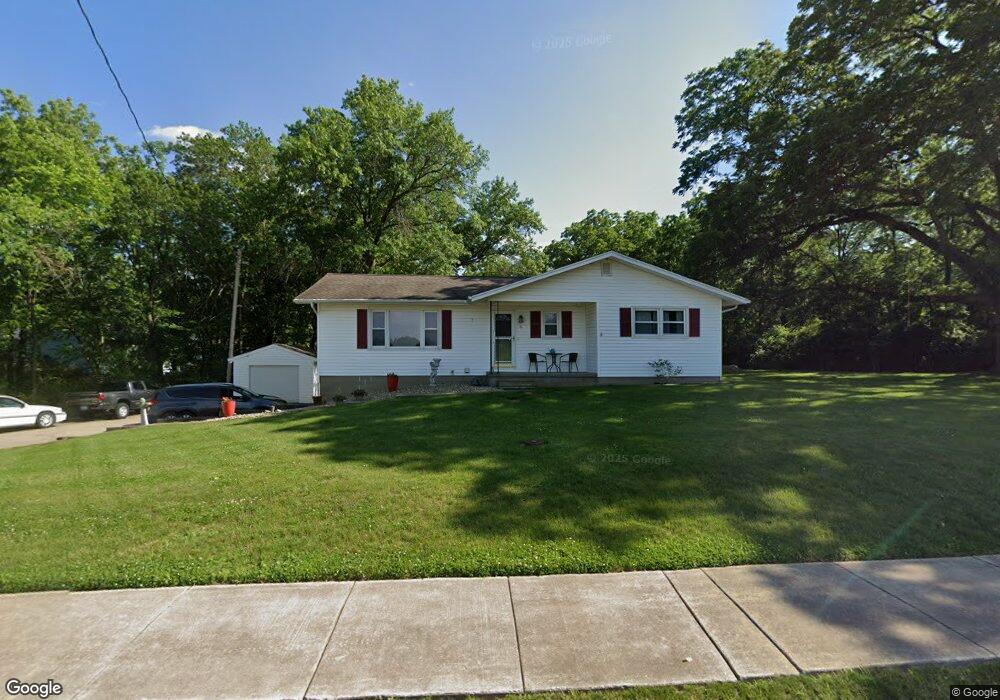
This home is located at 1625 W Grant St, Macomb, IL 61455 and is currently estimated at $141,400, approximately $111 per square foot. 1625 W Grant St is a home located in McDonough County with nearby schools including Edison Elementary School, Lincoln Elementary School, and Macomb Junior High School.
Ownership History
We collect this data history from publicly available records. To have your information removed, we recommend requesting removal directly through your county’s website.
Purchase Details
Home Financials for this Owner
Home Financials are based on the most recent Mortgage that was taken out on this home.Purchase Details
Home Financials for this Owner
Home Financials are based on the most recent Mortgage that was taken out on this home.Home Values in the Area
Average Home Value in this Area
Purchase History
We collect this data history from publicly available records. To have your information removed, we recommend requesting removal directly through your county’s website.
| Date | Buyer | Sale Price | Title Company |
|---|---|---|---|
| $133,500 | None Available | ||
| $106,000 | None Available |
Mortgage History
We collect this data history from publicly available records. To have your information removed, we recommend requesting removal directly through your county’s website.
| Date | Status | Borrower | Loan Amount |
|---|---|---|---|
| Open | $134,848 | ||
| Previous Owner | $104,105 |
Tax History
We collect this data history from publicly available records. To have your information removed, we recommend requesting removal directly through your county’s website.
| Year | Tax Paid | Tax Assessment Tax Assessment Total Assessment is a certain percentage of the fair market value that is determined by local assessors to be the total taxable value of land and additions on the property. | Land | Improvement |
|---|---|---|---|---|
| 2024 | $4,376 | $41,791 | $4,338 | $37,453 |
| 2023 | $4,930 | $40,053 | $4,158 | $35,895 |
| 2022 | $4,586 | $38,808 | $4,029 | $34,779 |
| 2021 | $3,720 | $38,808 | $4,029 | $34,779 |
| 2020 | $3,290 | $39,329 | $4,019 | $35,310 |
| 2019 | $3,298 | $36,286 | $4,130 | $32,156 |
| 2018 | $3,145 | $36,286 | $4,130 | $32,156 |
| 2017 | $3,078 | $36,286 | $4,130 | $32,156 |
| 2016 | $2,950 | $35,902 | $4,086 | $31,816 |
| 2015 | $2,890 | $35,082 | $3,993 | $31,089 |
| 2014 | $2,830 | $34,557 | $3,933 | $30,624 |
| 2013 | $2,776 | $34,557 | $3,933 | $30,624 |
Map
- 2001 W Jackson St Unit C
- 827 W Mcdonough St
- 131 W Barsi Blvd
- 100 S Quail Walk Rd
- 927 S Garfield St
- 10810 E 1000th St
- 1613 W Adams Rd
- 702 & 708 W Piper St
- 190 Arlington Dr
- 216 N Normal St
- 209 N Ward St
- 255 Jamestown Rd
- 130 Richmond Rd
- 1100 S Johnson St
- 335 W Chase St
- 30 Richmond Rd
- 713 W Calhoun St
- 236 W Fisk St
- 520 S Johnson St
- 1334 Parkview Dr
Ask me questions while you tour the home.