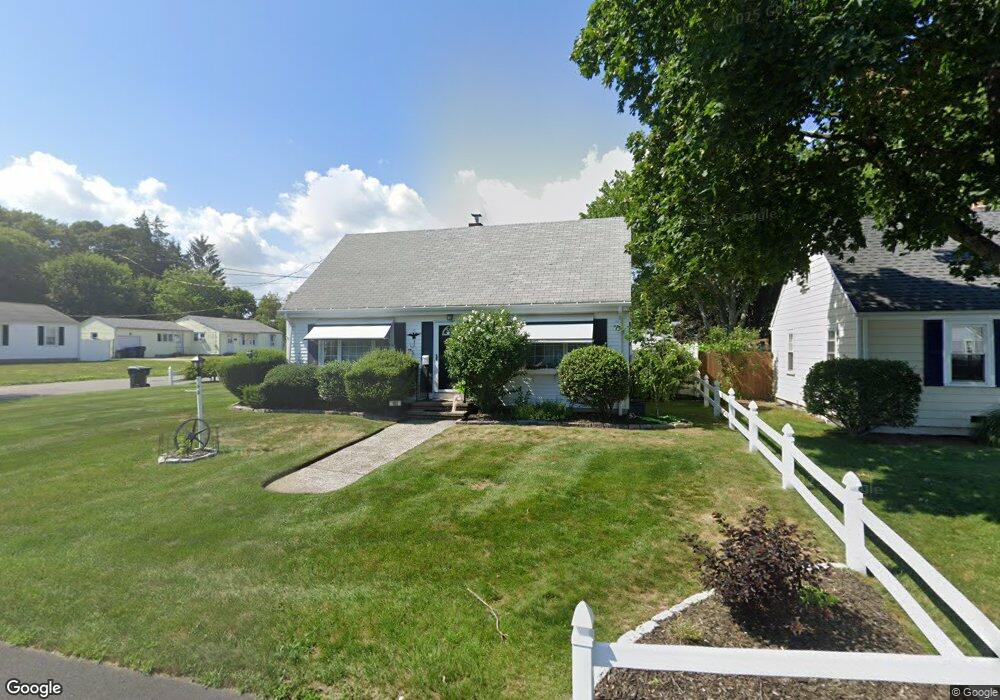
163 Omaha Blvd Warwick, RI 02889
Hoxie NeighborhoodEstimated Value: $378,582 - $414,000
3
Beds
1
Bath
1,253
Sq Ft
$319/Sq Ft
Est. Value
About This Home
This home is located at 163 Omaha Blvd, Warwick, RI 02889 and is currently estimated at $399,146, approximately $318 per square foot. 163 Omaha Blvd is a home located in Kent County with nearby schools including Saint Kevin School and Bishop Hendricken High School.
Ownership History
Date
Name
Owned For
Owner Type
Purchase Details
Closed on
Apr 11, 2012
Sold by
Bacon Barbara D
Bought by
Bacon Tr David A
Current Estimated Value
Create a Home Valuation Report for This Property
The Home Valuation Report is an in-depth analysis detailing your home's value as well as a comparison with similar homes in the area
Home Values in the Area
Average Home Value in this Area
Purchase History
We collect this data history from publicly available records. To have your information removed, we recommend requesting removal directly through your county’s website.
| Date | Buyer | Sale Price | Title Company |
|---|---|---|---|
| Bacon Tr David A | -- | -- |
Source: Public Records
Mortgage History
We collect this data history from publicly available records. To have your information removed, we recommend requesting removal directly through your county’s website.
| Date | Status | Borrower | Loan Amount |
|---|---|---|---|
| Previous Owner | Bacon Tr David A | $25,000 | |
| Previous Owner | Bacon Tr David A | $10,200 | |
| Previous Owner | Bacon Tr David A | $12,000 |
Source: Public Records
Tax History
| Year | Tax Paid | Tax Assessment Tax Assessment Total Assessment is a certain percentage of the fair market value that is determined by local assessors to be the total taxable value of land and additions on the property. | Land | Improvement |
|---|---|---|---|---|
| 2025 | $4,340 | $341,700 | $105,700 | $236,000 |
| 2024 | $4,136 | $285,800 | $87,300 | $198,500 |
| 2023 | $4,056 | $285,800 | $87,300 | $198,500 |
| 2022 | $3,954 | $211,100 | $61,000 | $150,100 |
| 2021 | $3,954 | $211,100 | $61,000 | $150,100 |
| 2020 | $3,954 | $211,100 | $61,000 | $150,100 |
| 2019 | $3,954 | $211,100 | $61,000 | $150,100 |
| 2018 | $3,415 | $164,200 | $54,600 | $109,600 |
| 2017 | $3,323 | $164,200 | $54,600 | $109,600 |
| 2016 | $3,323 | $164,200 | $54,600 | $109,600 |
| 2015 | $3,059 | $147,400 | $56,900 | $90,500 |
| 2014 | $2,957 | $147,400 | $56,900 | $90,500 |
| 2013 | $2,917 | $147,400 | $56,900 | $90,500 |
Source: Public Records
Map
Nearby Homes
- 49 Recess Ln
- 5 Recess Ln
- 204 Harmony Ct
- 12 Dean Ct
- 38 Rowe Ave
- 16 Althea Rd
- 48 Rowe Ave
- 80 Glendale Ave
- 72 W Shore Rd Unit 202
- 72 W Shore Rd Unit 104
- 23 Astral St
- 15 Community Rd
- 161 W Shore Rd Unit B4
- 79 Bellevue Ave
- 369 Manor Dr
- 157 Betsey Williams Dr
- 122 Leigh St
- 87 Frontier Rd
- 99 Potomac Rd
- 97 Delwood Rd
- 163 Cavalcade Blvd
- 48 Fairfield Ct
- 155 Cavalcade Blvd
- 38 Fairfield Ct
- 154 Cavalcade Blvd
- 147 Cavalcade Blvd
- 30 Fairfield Ct
- 303 Hoxsie Ave
- 310 Hoxsie Ave
- 146 Cavalcade Blvd
- 39 Fairfield Ct
- 295 Hoxsie Ave
- 15 Estelle Blvd
- 311 Hoxsie Ave
- 5 Estelle Blvd
- 29 Fairfield Ct
- 287 Hoxsie Ave
- 155 Omaha Blvd
- 154 Hoxsie Ave
- 164 Hoxsie Ave
Your Personal Tour Guide
Ask me questions while you tour the home.