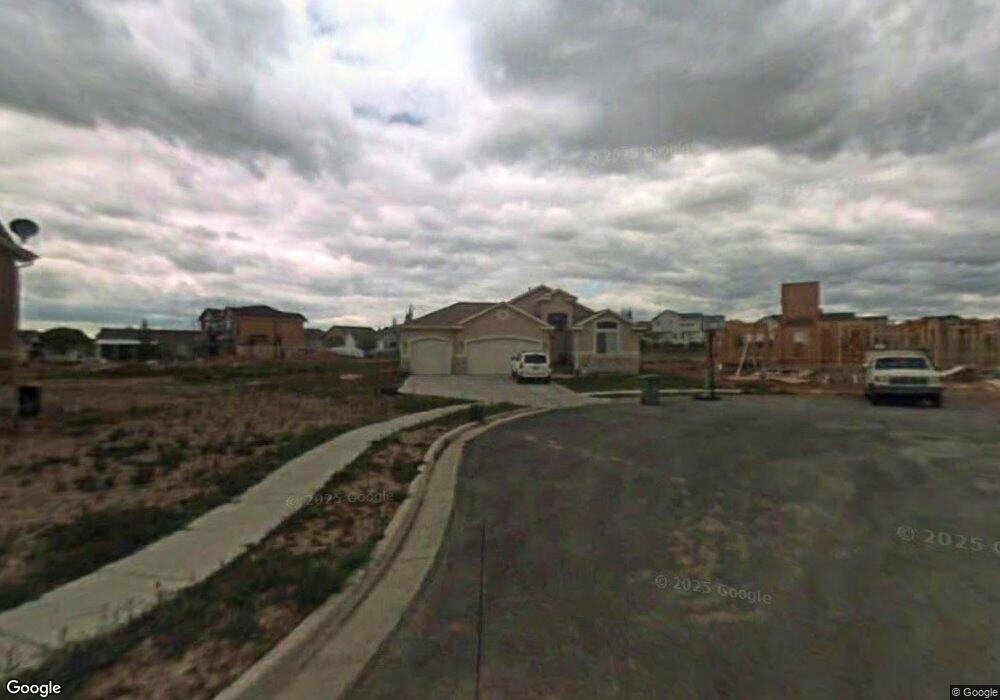
1639 N 150 E Layton, UT 84041
Estimated Value: $561,050 - $591,000
3
Beds
2
Baths
1,659
Sq Ft
$344/Sq Ft
Est. Value
About This Home
This home is located at 1639 N 150 E, Layton, UT 84041 and is currently estimated at $571,013, approximately $344 per square foot. 1639 N 150 E is a home located in Davis County with nearby schools including Lincoln Elementary School, North Layton Junior High School, and Northridge High School.
Ownership History
Date
Name
Owned For
Owner Type
Purchase Details
Closed on
Dec 21, 2012
Sold by
Seager Jesse
Bought by
Seager Jesse R
Current Estimated Value
Purchase Details
Closed on
Dec 27, 2005
Sold by
Perry Homes Inc
Bought by
Seager Ling I and Seager Jesse R
Home Financials for this Owner
Home Financials are based on the most recent Mortgage that was taken out on this home.
Original Mortgage
$181,468
Outstanding Balance
$101,954
Interest Rate
6.36%
Mortgage Type
Fannie Mae Freddie Mac
Estimated Equity
$469,059
Create a Home Valuation Report for This Property
The Home Valuation Report is an in-depth analysis detailing your home's value as well as a comparison with similar homes in the area
Home Values in the Area
Average Home Value in this Area
Purchase History
| Date | Buyer | Sale Price | Title Company |
|---|---|---|---|
| Seager Jesse R | -- | None Available | |
| Seager Ling I | -- | Meridian Title Company | |
| Perry Homes Inc | -- | Meridian Title Company |
Source: Public Records
Mortgage History
| Date | Status | Borrower | Loan Amount |
|---|---|---|---|
| Open | Seager Ling I | $181,468 |
Source: Public Records
Tax History
| Year | Tax Paid | Tax Assessment Tax Assessment Total Assessment is a certain percentage of the fair market value that is determined by local assessors to be the total taxable value of land and additions on the property. | Land | Improvement |
|---|---|---|---|---|
| 2025 | $417 | $310,200 | $118,222 | $191,978 |
| 2024 | $201 | $298,650 | $137,054 | $161,596 |
| 2023 | $2,908 | $542,000 | $156,600 | $385,400 |
| 2022 | $2,945 | $298,100 | $84,671 | $213,429 |
| 2021 | $496 | $405,000 | $123,890 | $281,110 |
| 2020 | $2,431 | $352,000 | $102,068 | $249,932 |
| 2019 | $2,376 | $337,000 | $94,999 | $242,001 |
| 2018 | $2,198 | $313,000 | $94,999 | $218,001 |
| 2016 | $270 | $153,395 | $31,749 | $121,646 |
| 2015 | $2,032 | $141,020 | $31,749 | $109,271 |
| 2014 | $319 | $144,058 | $31,749 | $112,309 |
| 2013 | -- | $127,445 | $33,088 | $94,357 |
Source: Public Records
Map
Nearby Homes
Your Personal Tour Guide
Ask me questions while you tour the home.