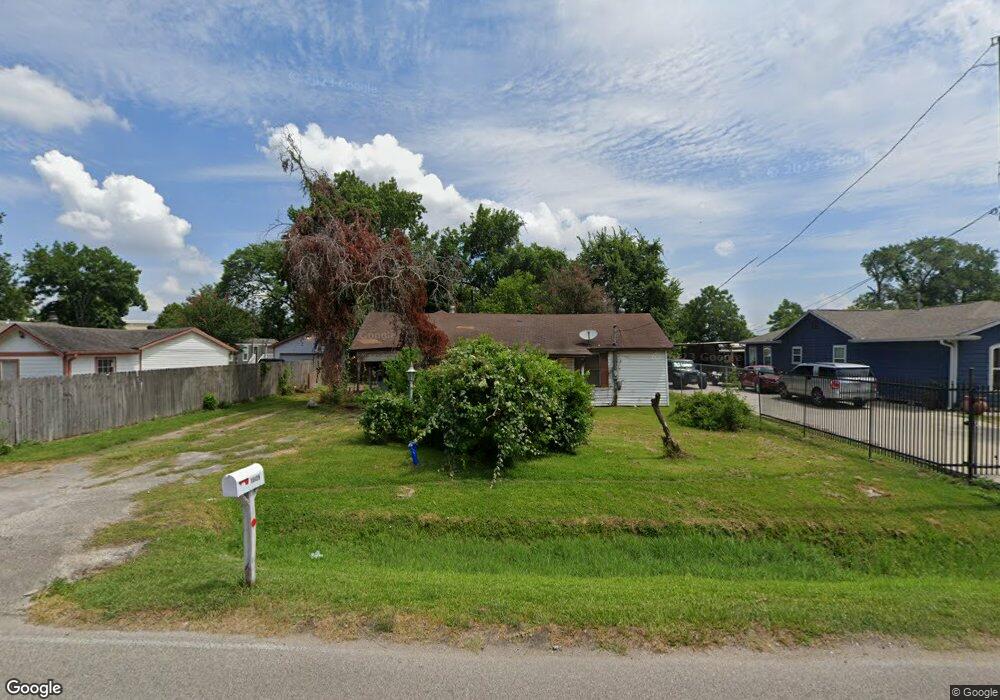
16409 Pecan St Channelview, TX 77530
Estimated Value: $168,335 - $218,000
3
Beds
1
Bath
898
Sq Ft
$210/Sq Ft
Est. Value
About This Home
This home is located at 16409 Pecan St, Channelview, TX 77530 and is currently estimated at $188,834, approximately $210 per square foot. 16409 Pecan St is a home located in Harris County with nearby schools including Channelview High School.
Ownership History
Date
Name
Owned For
Owner Type
Purchase Details
Closed on
Oct 24, 2025
Sold by
Chacon Jonathan
Bought by
Home Liquidators Llc
Current Estimated Value
Home Financials for this Owner
Home Financials are based on the most recent Mortgage that was taken out on this home.
Original Mortgage
$176,250
Outstanding Balance
$175,755
Interest Rate
6.35%
Mortgage Type
New Conventional
Estimated Equity
$13,079
Purchase Details
Closed on
Jul 3, 2025
Sold by
Bacon & Franklin Investments Llc
Bought by
Chacon Jonathan
Create a Home Valuation Report for This Property
The Home Valuation Report is an in-depth analysis detailing your home's value as well as a comparison with similar homes in the area
Home Values in the Area
Average Home Value in this Area
Purchase History
| Date | Buyer | Sale Price | Title Company |
|---|---|---|---|
| Home Liquidators Llc | -- | None Listed On Document | |
| Chacon Jonathan | -- | Envision Title | |
| Bacon & Franklin Investments Llc | -- | Envision Title |
Source: Public Records
Mortgage History
| Date | Status | Borrower | Loan Amount |
|---|---|---|---|
| Open | Home Liquidators Llc | $176,250 |
Source: Public Records
Tax History
| Year | Tax Paid | Tax Assessment Tax Assessment Total Assessment is a certain percentage of the fair market value that is determined by local assessors to be the total taxable value of land and additions on the property. | Land | Improvement |
|---|---|---|---|---|
| 2025 | $3,067 | $150,426 | $70,131 | $80,295 |
| 2024 | $3,067 | $150,426 | $70,131 | $80,295 |
| 2023 | $2,926 | $146,260 | $56,104 | $90,156 |
| 2022 | $1,833 | $115,185 | $36,467 | $78,718 |
| 2021 | $1,735 | $91,141 | $36,467 | $54,674 |
| 2020 | $1,672 | $77,639 | $30,858 | $46,781 |
| 2019 | $1,554 | $77,639 | $30,858 | $46,781 |
| 2018 | $0 | $53,803 | $10,519 | $43,284 |
| 2017 | $1,415 | $53,803 | $10,519 | $43,284 |
| 2016 | $1,414 | $53,803 | $10,519 | $43,284 |
| 2015 | $15 | $53,803 | $10,519 | $43,284 |
| 2014 | $15 | $44,434 | $10,519 | $33,915 |
Source: Public Records
Map
Nearby Homes
- 16935 Market St
- 16534 Market St
- 108 Cedar Ln
- TBD E Freeway Service Rd
- 908 Lakeside Dr
- 16809 Market St
- 16722 Avenue B
- 16128 Ridlon St
- 16032 1/2 Ridlon St
- 0 Bayou Dr
- 16230 Katherine Ln
- 1017 Woodland St
- 829 Becker St
- 831 Becker St
- 726 Banton St
- 16622 Water Oak Dr
- 0 Laurelwood Dr Unit 57304791
- 15627 Market St
- 16121 Palm St
- 1023 Becker St
Your Personal Tour Guide
Ask me questions while you tour the home.