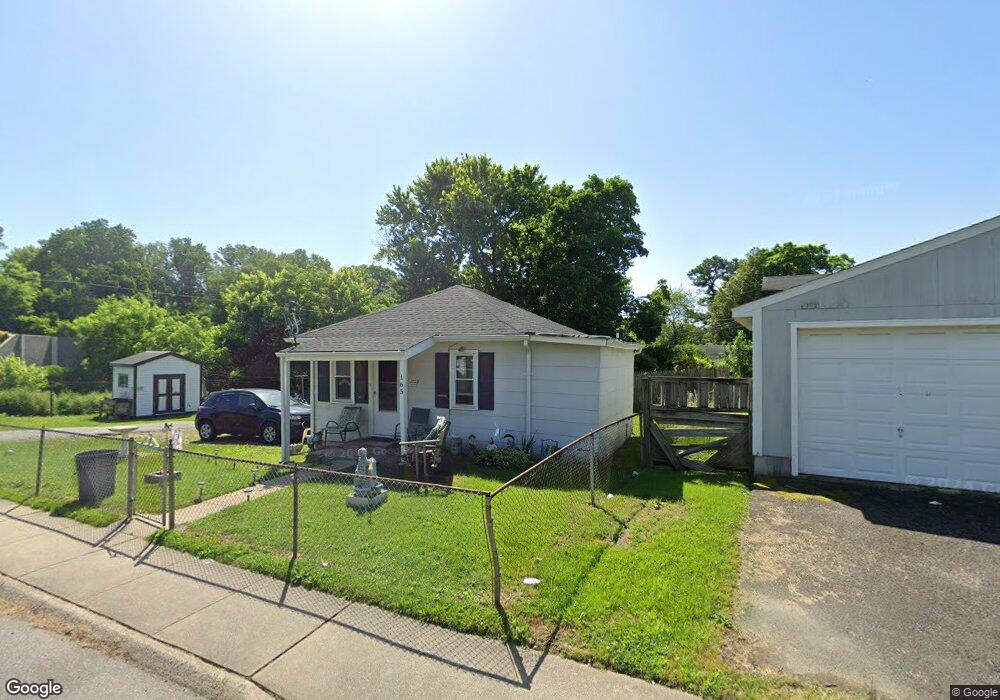
165 Post Rd Aberdeen, MD 21001
Estimated Value: $82,512 - $215,000
Studio
1
Bath
436
Sq Ft
$353/Sq Ft
Est. Value
About This Home
This home is located at 165 Post Rd, Aberdeen, MD 21001 and is currently estimated at $153,878, approximately $352 per square foot. 165 Post Rd is a home located in Harford County with nearby schools including Halls Cross Roads Elementary School, Aberdeen Middle School, and Aberdeen High School.
Ownership History
Date
Name
Owned For
Owner Type
Purchase Details
Closed on
Aug 31, 2022
Sold by
Corrigan Judy A
Bought by
Renelle Catherine L and Strong David Allen
Current Estimated Value
Purchase Details
Closed on
Sep 29, 1982
Sold by
Clessuras Zoe
Bought by
Pennington Lawrence C and Pennington Irene M
Home Financials for this Owner
Home Financials are based on the most recent Mortgage that was taken out on this home.
Original Mortgage
$14,500
Interest Rate
15.19%
Create a Home Valuation Report for This Property
The Home Valuation Report is an in-depth analysis detailing your home's value as well as a comparison with similar homes in the area
Home Values in the Area
Average Home Value in this Area
Purchase History
| Date | Buyer | Sale Price | Title Company |
|---|---|---|---|
| Renelle Catherine L | $55,500 | -- | |
| Renelle Catherine L | $55,500 | -- | |
| Renelle Catherine L | $55,500 | -- | |
| Renelle Catherine L | $55,500 | -- | |
| Renelle Catherine L | $55,500 | -- | |
| Renelle Catherine L | $55,500 | None Listed On Document | |
| Pennington Lawrence C | $17,500 | -- |
Source: Public Records
Mortgage History
| Date | Status | Borrower | Loan Amount |
|---|---|---|---|
| Previous Owner | Pennington Lawrence C | $14,500 |
Source: Public Records
Tax History
| Year | Tax Paid | Tax Assessment Tax Assessment Total Assessment is a certain percentage of the fair market value that is determined by local assessors to be the total taxable value of land and additions on the property. | Land | Improvement |
|---|---|---|---|---|
| 2025 | $769 | $84,533 | $0 | $0 |
| 2024 | $769 | $80,667 | $0 | $0 |
| 2023 | $732 | $76,800 | $45,800 | $31,000 |
| 2022 | $728 | $76,400 | $0 | $0 |
| 2021 | $728 | $76,000 | $0 | $0 |
| 2020 | $760 | $75,600 | $45,800 | $29,800 |
| 2019 | $760 | $75,600 | $45,800 | $29,800 |
| 2018 | $821 | $75,600 | $45,800 | $29,800 |
| 2017 | $812 | $81,500 | $0 | $0 |
| 2016 | -- | $81,500 | $0 | $0 |
| 2015 | $881 | $81,500 | $0 | $0 |
| 2014 | $881 | $82,900 | $0 | $0 |
Source: Public Records
Map
Nearby Homes
Your Personal Tour Guide
Ask me questions while you tour the home.