165 Upton St Northbridge, MA 01534
Estimated Value: $466,000 - $517,000
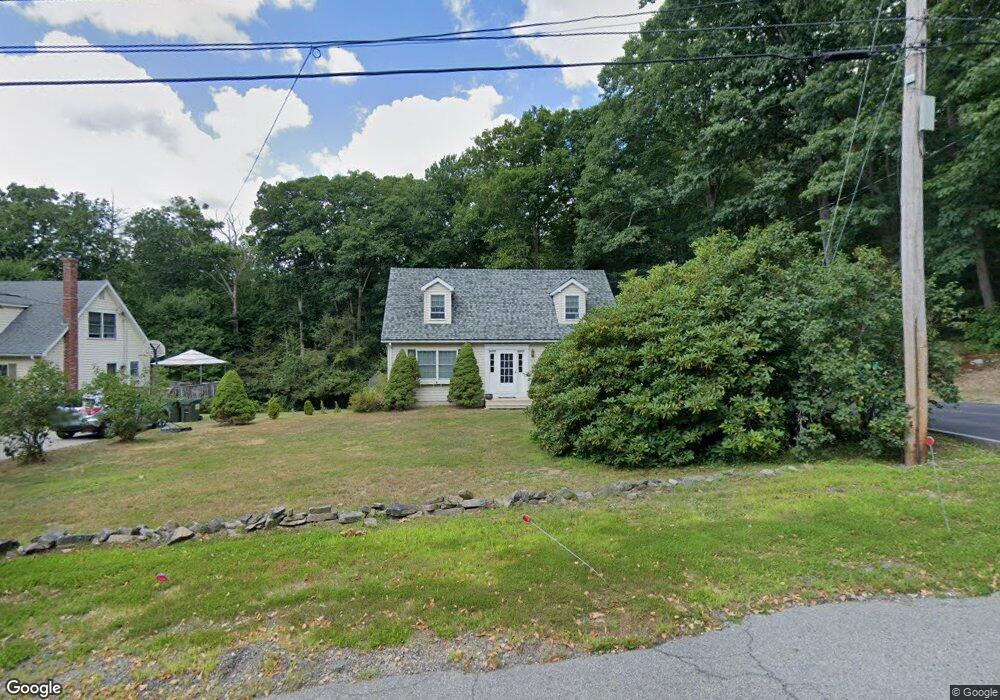
About This Home
This home is located at 165 Upton St, Northbridge, MA 01534 and is currently estimated at $488,209, approximately $353 per square foot. 165 Upton St is a home located in Worcester County with nearby schools including Northbridge Elementary School, Northbridge Middle School, and Northbridge High School.
Ownership History
We collect this data history from publicly available records. To have your information removed, we recommend requesting removal directly through your county’s website.
Purchase Details
Home Financials for this Owner
Home Financials are based on the most recent Mortgage that was taken out on this home.Home Values in the Area
Average Home Value in this Area
Purchase History
We collect this data history from publicly available records. To have your information removed, we recommend requesting removal directly through your county’s website.
| Date | Buyer | Sale Price | Title Company |
|---|---|---|---|
| $165,000 | -- | ||
| $165,000 | -- |
Mortgage History
We collect this data history from publicly available records. To have your information removed, we recommend requesting removal directly through your county’s website.
| Date | Status | Borrower | Loan Amount |
|---|---|---|---|
| Open | $105,000 | ||
| Closed | $105,000 | ||
| Previous Owner | $15,612 |
Tax History
We collect this data history from publicly available records. To have your information removed, we recommend requesting removal directly through your county’s website.
| Year | Tax Paid | Tax Assessment Tax Assessment Total Assessment is a certain percentage of the fair market value that is determined by local assessors to be the total taxable value of land and additions on the property. | Land | Improvement |
|---|---|---|---|---|
| 2025 | $4,633 | $393,000 | $133,200 | $259,800 |
| 2024 | $4,531 | $374,800 | $133,200 | $241,600 |
| 2023 | $4,450 | $343,400 | $126,200 | $217,200 |
| 2022 | $4,094 | $297,300 | $97,100 | $200,200 |
| 2021 | $3,733 | $268,100 | $92,400 | $175,700 |
| 2020 | $3,498 | $260,600 | $92,400 | $168,200 |
| 2019 | $3,326 | $251,200 | $92,400 | $158,800 |
| 2018 | $3,712 | $239,300 | $88,000 | $151,300 |
| 2017 | $3,086 | $228,100 | $88,000 | $140,100 |
| 2016 | $2,911 | $211,700 | $75,500 | $136,200 |
| 2015 | $2,833 | $211,700 | $75,500 | $136,200 |
| 2014 | $2,807 | $211,700 | $75,500 | $136,200 |
Map
- 656 Shining Rock Dr
- 2428-2430 Providence Rd
- 2294 Providence Rd
- 2246 Providence Rd
- 2248 Providence Rd
- 253 Shining Rock Dr
- 15 Legion Way
- 73 Fairway Dr
- 42 Shining Rock Dr
- 204 Sand Trap Ct Unit 204
- 2120 Providence Rd
- 172 Sutton St
- 9 Central Ave Unit 11
- 4 Central Ave
- 87 Shannon Way Unit 86
- 21 Seaver Farm Ln
- 16 Blackstone Ln
- 0 S Main St
- 74 Buttercup Ln
- 217 Brookway Dr
- 149 Upton St
- 158 Upton St
- 139 Upton St
- 127 Upton St
- 124 Upton St
- 117 Upton St
- 108 Upton St
- 105 Upton St
- 92 Upton St
- 79 Upton St Unit 81
- 67 Upton St Unit 69
- 58 Upton St Unit 60
- 58 Emond St
- 59-61 Upton St
- 59 Upton St Unit 61
- 127 School St
- 50 Upton St Unit 52
- 91 School St Unit 93
- 103-107 School St
- 43 Emond St
Ask me questions while you tour the home.